
Tags
Thanks to “Jackathon #8 Make an infographic in 4 hours” held by Intium Lab. I made some data visualisations of Air Quality in Beijing from the Year 2008 to 2015.
What is the data source and how big the data is?
The original data set includes 8 separate spreadsheets, each of which represents one year and contains about 10,000 lines of records. So after combining and cleaning the data, the total Excel file contains 121127 rows. However, the truth is, if we don’t do some cleaning, the data would be much larger.
Data Cleaning
Data collection could be ignored in this case because the data sets could be downloaded from the current website. Luckily, the data only includes 11 columns, most of which are useless to data analysis.

“Site”, “Parameter”, “Duration” and “Unit” are useless because the variables are consistent to one value just for reference. So here comes the questions:
- I would like to put all 8 separate files into one file so that I could do comparisons between these years and look into the trend.
- “QC Name” has 2 values: Valid or Missing. Missing means the data on that point is missed or the value is not valid. All we need is only the valid data points.
To solve the above problems, I asked a programmer, Chen Shen, in Intium Lab to help me with this. He just used several lines of Python codes to solve a problem that could last for half an hour if done by just copy & paste.
Data Analysis and Data Visualisation
Background Knowledge:
AQI represents Air Quality Index here in the text and original data uses PM 2.5 as the index. According to Wikipedia, “AQI is a number used by government agencies to communicate to the public how polluted the air currently is or how polluted it is forecast to become. As the AQI increases, an increasingly large percentage of the pollution is likely to experience increasingly severe adverse health effect.” Different countries have their own AQI, in our chart, we use the standard of U.S.
AQI Value for Different Levels:
0-50 Good; 51-100 Moderate; 101-150 Unhealthy for Sensitive Groups; 151-200 Unhealthy
To be clearer, the value we use in the chart is the average value of AQI.
- 2008-2015 Year Trend
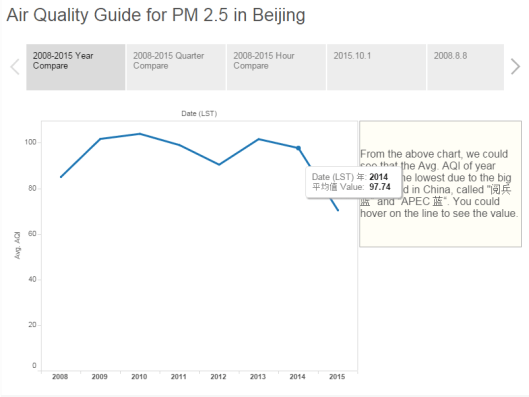
From the chart, we could see that 2015 has the lowest values of AQI, the second lowest is the year 2008. And the highest is 2010. (2015 has best air quality, and 2010 has the worst). But the result will be different if we use total values of AQI instead of average value, but using total numbers is ridiculous because I’ve mentioned above that some of the data points are missing but we don’t know when they are missing.
2. Season Compare

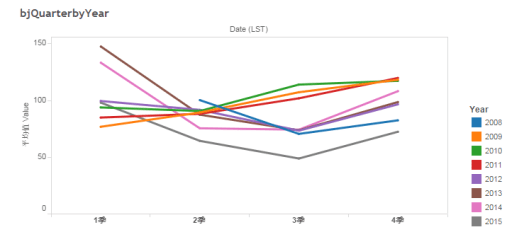
From the first chart, we could see that air quality will go down in winter and the other seasons would be better. But when comparing these years, the trends are different especially in the third season. Air quality of the year 2009,2010, 2011 is almost going up all around the year.
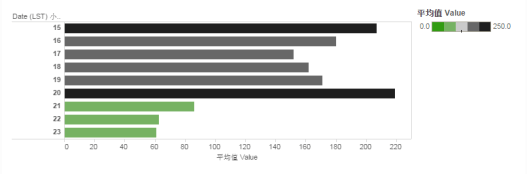
3. Hour Compare

The highest two points are 14/02/2010 and 23/01/2012. After checking this on the calendar, we would found that these 2 days are Spring Festival Eve 12:00 a.m. So it tells us that setting off firecrackers would do severely harm to the environment.

This chart is compared based on the data point of each hour. To be clearly visualised and better understood, I used green-black colour mode. The conclusion is that on average, air quality in the afternoon is most healthy especially at 15:00, and at night around 23:00, the air is the worst.
4. Look into Specific Day
01/10/2015: After Chinese Military Parade, how is the air quality? Perfect!

08/08/2008: Let’s see how is the air quality on the Olympics Opening Ceremony. In contrast to my anticipation, the result is totally different.

I randomly chose a day in the year 2008: 08/04/2008:
It is completely reverse that air quality at 23:00 is much better than at 15:00.
To see complete&interactive data visualisation, please click here:
Tableau Public: Air Quality Guide for PM 2.5 in Beijing

Pingback: National Congress: signs for a clearer sky in Beijing – The Data & News Society