• Home
  • Event
  • Article
    • Gallery
    • Opinion
    • Resources
  • About
    • Founding Members
    • Steering Committee
    • Executive Officers
  • Newsletter

The Data & News Society

~ news/numbers; stats/stories

The Data & News Society

Category Archives: Tutorial

How China Blockbuster War Movies Capture China’s Nationalism

15 Sunday Apr 2018

Posted by chico_x in news story, Tutorial

≈ Leave a comment

Tags

COMM7780/JOUR7280, film, nationalism, Python

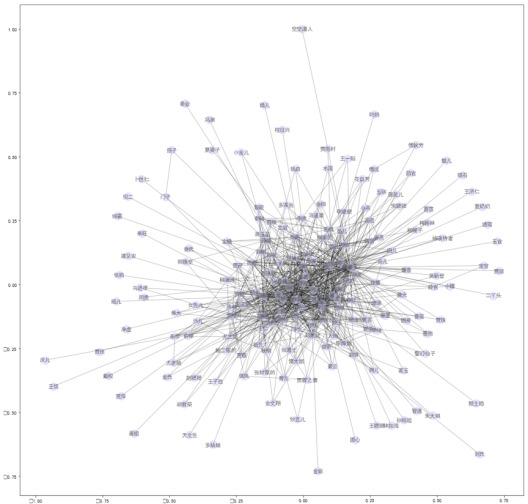
Summary: China Blockbuster War Movies become more and more popular in the global. The national movie frequently takes on the responsibility of representing the national identity to its citizens or even the world. How does China Blockbuster War Movies Capture China’s Nationalism? What is the opinion of the public? We used Douban as the source to extract data from the film reviews of two movies (“Operation Red Sea” and “Wolf Warrior” ) on the Douban, a popular art consumption and rating website, to figure out the thought of people behind the screen and the future development of Blockbuster War Movies in China. With the help of Python, we made a Wordcloud picture of the frequent words included in the 1,000 pieces of films reviews for each movie. We found that China’s new breed of patriotic hero on the big screen reflects the rise of a superpower and  China’s War Movies is shaping the image of China.

Last month, movie tickets sales in mainland China hit 10.1 billion yuan ($1.6 billion), a box office world record for monthly sales in a single market. No film stood out more than “Operation Red Sea.”, which had grossed almost 2.5 billion yuan in just 13 days by the end of February.

未标题-1.jpg

 “Operation Red Sea” is based on the Chinese navy’s March 2015 evacuation of Yemen. Set amid militant unrest in a fictional Middle Eastern country, it tells the stories of a ship’s crew and an assault team as they rescue Chinese citizens and foreign refugees, resolving a potential nuclear crisis along the way.

Similarly, last summer’s blockbuster “Wolf Warrior 2,” ($854 million), tells the stories of a loose-cannon Chinese soldier in an unnamed African country. “Operation Red Sea” tones down the patriotism of last year’s smash hit film ‘Wolf Warrior 2’, playing up gore over glorifying war.

How does China Blockbuster War Movies Capture China’s Nationalism? What are the opinion of the public in China and the globe? Can these films be a step towards making Chinese action films more palatable overseas? We will make some Analysis based on the data.

Continue reading →

National Congress: signs for a clearer sky in Beijing

15 Sunday Apr 2018

Posted by chico_x in news story, Tutorial

≈ Leave a comment

Tags

Air Pollution, COMM7780/JOUR7280, Python

Summary:In this article, we collected the data of the air quality in Beijing over the past 5 years.We assumed that the significant changes or improvements in air quality were related to China’s two top Annual Sessions – the Chinese People’s Political Consultative Congress (CPPCC) and the National People’s Congress (NPC).Besides, there were several news and current affairs affected the air quality in Beijing. We will also take a closer look at its air quality at that time to see if there are significant pollutants reductions during those periods.

Four years ago, the Chinese premier, Li Keqiang, said at the National People’s Congress and many more Chinese citizens watching live on state television, “We will resolutely declare war against pollution as we declare war against poverty”.

Since then, cities have cut concentrations of fine particles in the air by 32 percent on average. Just a few months before the premier’s speech, the country has released a national air quality action plan to require all urban areas to reduce concentrations of fine particulate matter pollution by at least 10 percent. As the capital city, Beijing was required to reduce pollution by 25 percent, of which the city set aside a massive $120 billion yuan to achieve this target.

All the statics in this project comes from Online China’s Air Quality , which is a public platform monitoring and analyzing China’s air quality covering statistics from 367 cities with AQI, PM2.5, PM10, S02, N02, O3, CO, temperature, humidity, wind scale, wind direction, satellite cloud picture and so on.

In this project, we mainly focus on Beijing’s air quality including AQI, air pollution category, and main pollutants such as PM2.5 during December 2013 to March 2018.

Continue reading →

Li’s family business map and spring layout analysis

15 Sunday Apr 2018

Posted by chico_x in news story, Tutorial

≈ Leave a comment

Tags

COMM7780/JOUR7280, Python, Social Network

Summary: In this article, from the graph of major holding companies and it’s main shareholders under Richard Li Tzar Kai, Victor Li Tzar Kuoi, and Li Ka-shing, we found in what areas are they investing and the complex network of relationships between subsidiaries. By analyzing the annual reports of Victor Li Tzar Kuoi and Richard Li Tzar Kai’s company’s companies, we can determine whether Li Ka-shing made the right decision when he announced his retirement. 

Background:

Li Ka-shing, a Hong Kong billionaire who will turn 90 this summer, announced his official retirement in May 2018. In January 2015, “Forbes” magazine announced the ranking of Hong Kong’s richest man-Li Ka-shing’s net assets totaled 33.5 billion U.S. dollars, or 260 billion U.S. dollars, making him the richest man in Hong Kong, only replaced by SF Express’s founder Wang Wei in 2017.

He announced on March 16th that he’ll step down as chairman of CK Hutchison Holding Ltd. and CK asset Holding Ltd., making way for his eldest son, Victor Li Tzar Kuoi. Victor assisted Li Ka-shing to run CK holding Ltd. for many years and his youngest son, Richard Li Tzar Kai mainly invested in communications and media business outside.

Richard Li Tzar Kai

We grabbed the information from Who’s Who and HKEX(The Stock Exchange of Hong Kong Limited) and got the name of major holding companies and main shareholder of companies. after establishing their relationship, we got graph below.

1

Business Map of Richard Li Tzar Kai

Continue reading →

Who control the discourse power in 红楼梦?

15 Sunday Apr 2018

Posted by chico_x in news story, Tutorial

≈ Leave a comment

Tags

COMM7780/JOUR7280, Python, Social Network

Summary: Dream of the Red Chamber, also called The Story of the Stone, composed by Cao Xueqin, is one of China’s four great classical novels. Long considered a masterpiece of Chinese literature. The novel is generally acknowledged to be the pinnacle of Chinese fiction. We use the graphics tool to analyze the short path, centralization, structure of degree, clustering coefficient and the clique of those data. And try to find out how closely those characters are connected, and who might be the Social Queen or King in this story.

According to analyst Jiang Qi, there are 448 characters in “A Dream of Red Mansions”. We picked 187 characters who are relatively more important than others in this book and use the graphics tool to analyze these data and get the network below to show their relationship in the Dream of the Red Chamber.

2

The relationship between the 187 characters in the book

Continue reading →

Analyze tracking errors between ETF and stock market index in the last decade

26 Monday Mar 2018

Posted by chico_x in news story, Tutorial

≈ Leave a comment

Tags

COMM7780/JOUR7280, Data Visualization, Finance, Fund, Python

5571521786922_.pic_hd.jpgSummary: In this article, under the context of Hong Kong’s Mandatory Provident Fund scheme (MPF), we find that some Exchange Traded Fund (ETF) occupy large holdings in a particular MPF fund. By calculating the tracking errors over the past ten years, the year of 2008 stands out with the highest tracking error, which corresponds with the global financial crisis. In other years with more stable stock markets, ETF performs relatively well. We also calculate returns between two ETFs and the indexes they track respectively; the results turn out to be different.

We use Python as a calculator, rely on pandas to read csv files downloaded from Yahoo Finance, and time series to present data in the form of charts.

Background

Hong Kong has a rapidly aging society. According to the Population Projections released by Census and Statistics Department, HK is expected to have a third of its population that aged 65 and above by the mid of 21st century. There is a growing concern over the issue of social security especially for the elderly, since the burden for the employed population in the future to take care of the retirees will be unbearable.

Continue reading →

Inside Douban’s Top 250, a door pries into the world of audiences in mainland China

15 Thursday Mar 2018

Posted by chico_x in news story, Tutorial

≈ Leave a comment

Tags

COMM7780/JOUR7280, film, movie, Python

Summary: In this article, we crawl and analyze the top 250 films evaluated by DouBan users, find their preference on specific directors, types and regions, and also see trends of movies in different regions, particularly in America and Hong Kong. Besides, we pay attention to analyze the rise and down of Hong Kong film productions, and also add some background information for a better understanding. 

1

Douban top 250

In general, the best ways to reflect a movie’s preference and prevalence are through box office and ratings. But box office is biased since lots of movies are blocked in China and people are likely to be affected by several factors.  Thus, it’s more objective to examine it through ratings.

Douban Movie is a famous Chinese film rating site, with millions of users watching, rating, and commenting on movies day by day. Considering a large number of Douban users and the relatively objective measurement, data from the Top 250 list is suitable for our analysis.

Continue reading →

Data News of the Week: A World Defended and Invaded by Data – a Technical News Story Covering NSA Files Leak

08 Thursday Mar 2018

Posted by jessiepyt in Resources, Tutorial

≈ Leave a comment

Tags

DataNews, DNW, FilesLeak, NSA

Do you consider your personal information well protected? You use different passwords for different accounts, keep your social network activity private, even fake your profile on social media. Your efforts are probably in vain.

Everything you have done is under surveillance and your life pattern can even be figured out by people who are thousands of millions away from you. The government knows that you called Daisy three times in twenty-four hours, with one after midnight. You use Google Map in Central, Hong Kong at 2pm and your route is also recorded. You may wonder: I am just nobody. Why will somebody spare effort to analyze my data? In fact, you are somebody. Three degrees of separation points out that if you have 190 friends on Facebook, then after “three hops”, the network you can reach is even bigger than the population of Colorado.

Continue reading →

Workshop recap: How Does HKBU Library Preserve Vintage Documents Using OCR?

04 Sunday Mar 2018

Posted by Erin Chan in Event, Tutorial

≈ Leave a comment

Tags

data collection, Digitalization, library, OCR, Scan

Technology has changed our way of researching and our reading habit after the Internet became the popular platform for the release of news and information. The documents and publications from the non-information era are still invaluable for us especially when it comes to referencing and history learning. Yet, these resources are black and white and read all over, which does not fit in today’s mode of information processing. To digitalise these old documents, four students from Baptist University (BU) learned about the technique and usage of software in Optical Character Recognition (OCR) workshop.

IMG_9357

Using OCR machine to preserve information on old documents.

Continue reading →

Hong Kong Midnight Dinning Guide

02 Friday Mar 2018

Posted by chico_x in Tutorial

≈ Leave a comment

Tags

COMM7780/JOUR7280, food, Nightlife in Hong Kong, Python, restaurants

Summary: Hong Kong is a commercial hub that never sleeps in Asia. There are numerous restaurants feeding workaholics who work overtime and party animals who indulge in strongly beating music and alcohol at midnight. We search on OpenRice, the most popular dining guide website in Hong Kong, and find that there are 942 restaurants still open after 11.30am in Hong Kong. Among them, we crawl the information of 250 most popular ones among them in order to pitch an overall scene of Hong Kong’s midnight dinner.

We try to figure out four points below:

  • Where to hunt midnight food in Hong Kong?
  • How much do you need to pay a meal at midnight?
  • What kinds of food are provided at midnight?
  • What kinds of restaurants can you choose at midnight?

After that, we make a recommendation on midnight restaurants based on our analysis results.

Continue reading →

Earthquakes in Southeast Asia in 50 years

02 Friday Mar 2018

Posted by chico_x in Tutorial

≈ Leave a comment

Tags

COMM7780/JOUR7280, earthquake, GIS, open data, Python, USGS

Summary: We used API (Application Programming Interface) as the source to extract data from the USGS database in order to analyze the last 50 years and estimate the frequency of earthquakes in Southeast Asia. With the help of Python, the extracted data was exported into CSV file for categorizing different parameters such as by country, magnitude and year.

Introduction

Application programming interface (API) is commonly used to extract data from a remote website server. In layman term, API is used to retrieve data or information from another program. There are several websites such as Facebook, the USGS, Twitter, Reddit, which offer web-based API helping get information or data.

In order to retrieve data, we will send requests to the host web server where you want to extract the data and tweak parameters like URL in the module to connect to the server. Different websites have different requests format and can easily be accessed through the host’s website.

In our module, we will be extracting the data of earthquakes that hit Southeast Asia in the last 50 years from the web server of USGS using API.

One of the most frequent natural disasters on planet earth is earthquake. The sharp unleash of energy from Earth’s lithosphere generates seismic waves which lead to sudden shaking of the surface of the Earth. This natural disaster has led to the death of thousands of millions of people all around the world.

The strength of earthquakes is measured through Richter magnitude scale or just magnitude. The magnitude is the scale which ranges from 1-10.

The most highly sensitive region in the world prone to the earthquakes are Southeast Asian countries. To find the trend in the region, we extracted 50 years data from USGS by using API and convert the numbers into CSV file through Python coding for a comprehensive understanding of earthquakes situation in Southeast Asia.

Continue reading →

← Older posts

Top Posts & Pages

  • The International Fur Trade: Data and Measurements
  • Create Simple Filled Map (HK) in Tableau
  • At a glance: Hong Kong poverty situation
  • Recap of SCMP infographic designers’ guest lecture in HKDI
  • The effectiveness of Hong Kong public libraries is diminishing

Recent Posts

  • A dossier of data journalism teaching strategies: Words from journalism educators worldwide
  • “中国数据可视化大赛”创作者专访:数据“几人行”
  • “Whoah, wait a minute, every reporter needs to be a data reporter”: Conversations with two generations of data journalists at the Los Angeles Times
  • Aaron Mendelson: Would numbers work with radio?
  • 首届“中国数据可视化大赛”启动-数据中的宏观和微观世界
  • Job Opportunity: Market Information Specialist at Unum Networks

Recent Comments

A quick video I made… on New towns fail to be self-cont…
Erin Chan on Create Simple Filled Map (HK)…
National Congress: s… on “Big Data” Tells Y…
Pili Hu on Data News of the Week | Gender…
Pili Hu on Key Takes from Jessica Lo…

Archives

  • August 2019
  • June 2019
  • April 2019
  • March 2019
  • February 2019
  • December 2018
  • November 2018
  • October 2018
  • September 2018
  • June 2018
  • May 2018
  • April 2018
  • March 2018
  • February 2018
  • January 2018
  • December 2017
  • November 2017
  • October 2017
  • September 2017
  • August 2017
  • May 2017
  • April 2017
  • March 2017
  • February 2017
  • January 2017
  • December 2016
  • November 2016
  • October 2016
  • September 2016
  • August 2016
  • July 2016
  • June 2016
  • May 2016
  • April 2016
  • March 2016
  • February 2016
  • January 2016
  • December 2015
  • November 2015

Meta

  • Register
  • Log in
  • Entries feed
  • Comments feed
  • WordPress.com

Recent Posts

  • A dossier of data journalism teaching strategies: Words from journalism educators worldwide
  • “中国数据可视化大赛”创作者专访:数据“几人行”
  • “Whoah, wait a minute, every reporter needs to be a data reporter”: Conversations with two generations of data journalists at the Los Angeles Times
  • Aaron Mendelson: Would numbers work with radio?
  • 首届“中国数据可视化大赛”启动-数据中的宏观和微观世界

Recent Comments

A quick video I made… on New towns fail to be self-cont…
Erin Chan on Create Simple Filled Map (HK)…
National Congress: s… on “Big Data” Tells Y…
Pili Hu on Data News of the Week | Gender…
Pili Hu on Key Takes from Jessica Lo…

Archives

  • August 2019
  • June 2019
  • April 2019
  • March 2019
  • February 2019
  • December 2018
  • November 2018
  • October 2018
  • September 2018
  • June 2018
  • May 2018
  • April 2018
  • March 2018
  • February 2018
  • January 2018
  • December 2017
  • November 2017
  • October 2017
  • September 2017
  • August 2017
  • May 2017
  • April 2017
  • March 2017
  • February 2017
  • January 2017
  • December 2016
  • November 2016
  • October 2016
  • September 2016
  • August 2016
  • July 2016
  • June 2016
  • May 2016
  • April 2016
  • March 2016
  • February 2016
  • January 2016
  • December 2015
  • November 2015

Categories

  • Announcement
  • Announcements
  • Article
  • Book
  • Colloquium
  • comment
  • Event
  • Field Trip
  • Gallery
  • general
  • news story
  • Open Lecture
  • Opinion
  • Resources
  • Tool
  • Tutorial
  • Uncategorized

Meta

  • Register
  • Log in
  • Entries feed
  • Comments feed
  • WordPress.com

Blog at WordPress.com.

  • Follow Following
    • The Data & News Society
    • Already have a WordPress.com account? Log in now.
    • The Data & News Society
    • Customize
    • Follow Following
    • Sign up
    • Log in
    • Report this content
    • View site in Reader
    • Manage subscriptions
    • Collapse this bar
 

Loading Comments...