
Professor Jordan Peterson has been the center of attention in last few weeks for participating in a number of debates regarding gender wage gap. Unlike the feminists calling for the reduction of discrimination over salary, he believes gender wage gap is an explainable consequence of multiple social factors rather than a problem caused by discrimination. Is he right? After all, why is there gender wage gap? Looking into 3 reports (Why is There a Gender Wage Gap – Our World in Data, Six Key Facts About the Gender Pay Gap – Our World in Data, Gender Pay Gap: the Day Women Start Working For Free – Washington Post) and a published recently with analytics over statistics regarding gender wage gap will give us a thorough understanding of current gender wage gap.
1.Graph
1.1 How to measure gender wage gap
Washington Post collected the average income of men and women from different occupations and calculated the gap between male and female by each occupation. The result shows as below, y-axis represents the gap between hourly income and x-axis shows different jobs. The vertical line will be above 0 and red if for that occupation male earns more than women hourly, otherwise it will be black and below 0. Therefore we can tell among these more than 2 hundreds of jobs, there are only a few vertical lines below 0 which are not even noticeable.
It is easy to conclude that gender wage gap is a common issue among occupations nowadays.

Apart from calculating the wage differences and visualize them as the height of a vertical line, there are still several ways to demonstrate gender gap.
In Article Why is There a Gender Gap, gender pay gap is presented in the form of female-to-male wage ratio in the bar chart as shown below.

Gender Pay Gap: the Day Women Start Working For Free illustrated the wage gap in the way that female would be working for free for certain days at the end of every year since if they were male they would have already earned the amount of their annual salary by then. Since the wage gap differs from occupation to occupation, it is shown in different calendars for varying occupations and allows readers to search for the occupation they want to look at in a search engine below. Each square represents a year, and the red part of the year covered in red shows those days women would be working for free.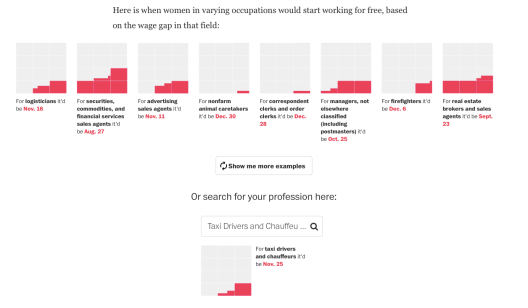
There is also a news game about wage from the Initiumlab. The game aims to measure the performance of a certain monthly salary in different groups, and dimensions of the groups include region and gender. For instance, for the monthly salary of 8,000 in Kowloon Town, this salary would outrun 56% of female or 11% of male. It also indicates the gender pay gap between male and female.

1.2 Evolution of gender gap throughout the 1970s
Gender wage gap has actually been a historical issue, but with the changes of social forces and spread of education, the gap has shrunk since the 1970s.
Article Six Key Facts has given the wage ratio of female-to-male since 1980. The unadjusted wage ratio (the raw ratio unadjusted for covariates) in the US has been decreasing.
Meanwhile, as shown in the article Why is There a Gender Gap, the wage gap of other countries also have the trend of decreasing, and in some cases the decrease is remarkable.

The main reason that reduced the wage gap is the improving equality of education. As mentioned in the article Why is There a Gender Gap, education and experience used to help explain a very large part of the pay gap in 1980, but this changed substantially in the decades that followed.
1.3 How do social factors influence gender pay gap?
The chart below shows the relationship between gender pay gap and GDP per capita. The vertical axis represents the percentage of gender wage gap, and the horizontal axis represents one country’s GDP per capita. There seems to be a common sense that countries with higher GDP may have a bigger pay gap. However, from this chart we can tell there is no linear relation between wage gap and GDP. In fact, the gender pay gap is smaller in middle-income countries.

Therefore, since GDP is not the factor that determines gender pay gap, what factors would influence the wage gap? Article Six Key Facts About Gender Gap has given the chart below to show the identity of factors that explained gender gap and how much the influence it has on the gap in 1980 and 2010.

As the graph shows, the influence of occupation choices on gender wage gap has a remarkable growth compared to 1980. It means that women’s choices on jobs account for a great part of gender pay gap – women would choose the relatively lower paying jobs from the job market. There multiple reasons for that, as women in their motherhood or expecting motherhood would need a more flexible schedule at work to take care of her children, while jobs with high flexibility usually indicate a lower wage. The chart below from article Why is There a Gender Gap shows the impact of children on female and male salary.

This graph visualizes the difference in earnings caused by childbirth using line charts. The vertical red line representing “first childbirth”separates the chart into two sections, giving the audience a direct visual impact of comparison. We can see that after the first childbirth women face drastic impact on earnings, which is called child penalty. What’s worse, they will never recover to what they could have achieved without babies. From the slight downward movement of men’s earnings after first childbirth, however, we can see that child penalty for men is too little to be noticed.
And despite what reason is there behind, women are indeed choosing lower-income jobs. The graph from article Gender Pay Gap: the Day Women Started Working For Free shows the distribution of men and women on the x-axis represents hourly income. In this graph, purple is for women and yellow is for men. Every 2 circles connected together by red or black lines is one occupation, and the size of circles represents the number of men/women of that occupation. The highlighted purple and yellow circles are the top ten occupations that most women or men are taking. It can be told that the biggest 10 purple circles are mostly on the left, which means lower salary; while the biggest 10 yellow circles are relatively right.

Let’s go back to the influence of social factors that determine gender wage gap.
Occupation choice is not the only factor that changed greatly in its influence on gender wage gap, the ‘unexplained’ residual also changed considerably. over the period 1980-2010. This means the observable characteristics of workers and their jobs explain wage differences better today than a couple of decades ago. At first sight, this seems like good news – it suggests that today there is less discrimination, in the sense that differences in earnings are today much more readily explained by differences in ‘productivity’ factors. But is this really the case?
The unexplained residual may include aspects of unmeasured productivity (i.e. unobservable worker characteristics that cannot be controlled for in a regression), while the “explained” factors may themselves be vehicles of discrimination.
Pay gap deniers purport that women’s choices, rather than discrimination, cause the pay gap between women and men. But those choices are actually consequences of the social forces at play.
Hence, while the unexplained residual gives us a first-order approximation of what is going on, we need much more detailed data and analysis in order to say something definitive about the role of discrimination in observed pay differences. I will discuss the evidence on discrimination further below.
2.Text
Texts of the three articles have served well for readers to understand the contexts, but with different styles of writing.
Since article Why is there a gender pay gap is a research paper published on an academic website, the writing style is rather professional along with long sentences that are not common in news stories. The article followed a clear logic. It first explained what is gender pay gap, then illustrated the reasons why the gap exists, after that it gives practical advice accordingly to narrow the gap. The graphs in the article helped to give a straightforward prove of what the author tries to tell with text.
The words used in article Six Key Facts are easy to understand since the purpose of the text is to tell what story can be found from visualized statistics. It gave explanations of what are reasons that led to the one consequence or phenomenon.
While Gender Pay Gap: the Day Women Start Working For Free focused more on the interaction between visual elements and text. After an overview of main points, as the reader reads further down, there will be different highlights on the graph along with explanations of different parts of the graph below. Each text box serves for one idea as one paragraph with the prove of visualized statistics. Since all the ideas are concluded from the same original statistics, the three text boxes appear orderly in one graph with the highlights of different parts of it. It gives a continuous and logical impression rather than presenting the three ideas separately.

3. Interaction

This is an interactive map from article Why is There a Gender Gap presenting the changes from 2009 to 2015 about whether non-pregnant and non-nursing women are allowed to do the same jobs as men. It simply colors those countries which allow so in green and those not in red. But as pulling the progress bar from 2009 to 2015, we can see that only 2 countries turned from ‘no’ to ‘yes’, 1 from ‘no data’ to ‘yes’, while 3 from ‘yes’ to ‘no’, and 10 from ‘no data’ to ‘no’. The changing regions are not big in size, and readers may confuse on which color represents which attitude. Moreover, their attention may be drawn by the 10 countries which turned from ‘no data’ to ‘no’. Thus, without observing overly closely, this map may not tell a good story.
These articles also brought some news games regarding gender gap. Readers can look for the part they what to look at in these games which is a good strategy to draw attention. And all interactive parts from these articles work well both in PC and mobile phones, allowing readers to read the article on multiple devices.

4.Conclusion
In summary, the data visualization of both projects has well explained the concept of gender pay gap and given the dimensions on how to measure it. Why is There a Gender Gap and Six Key Facts about Gender Gap focus more on graphical interpretation while Gender Pay Gap: the Day Women Start Working For Free puts more emphasis on integration of text and visualised elements. The news game from the initiumlab gives no explanation but makes it rather straightforward for readers to understand the bunch of statistics it collected.
The gender gap is a good topic for data visualization. Since there are a lot of statistics of it to be found, but they are unlikely to be understood by normal readers since there are complex dimensions to measure it. Also, gap means there would be comparisons of different data and visualization can help to empathize it. Both projects have fulfilled its job to explain the context with the help of text and graphs.
Author/ Ding Chang, Zhu Fangyao and Nie Yuange ( JOUR2106 Data Visualisation (2018) – Group 4 )
Editor/ Jessie Pang
Data News of the Week (DNW) is a weekly issue of news summaries hand picked by our editors. It features a GLOCAL (global+local) perspective for the topic of concern. It tracks the latest developments from the industry and academics for methodology, tools, datasets and news agenda.

Why do female academics publish less than their male peers?
http://www.languageonthemove.com/20818-2/
LikeLike