
Summary: Unfair and imbalanced news stories always mislead readers, hiding and even distort truths, thus decreasing the credibility of media as well as increasing ‘news victims’. As a qualified news organization, one must get its news as close to the fact as possible. This time we want to take China Daily as an example, to analyze whether its news is fair or not.
We decided to rely on data to quantize the requirement, thus we use python to show the most effective way to figure out the fairness of news.
Background: Difficulty to Reach Absolute Objectivity
According to the Cambridge online dictionary, objectivity means “not influenced by personal opinion or feeling.” For a long time in journalism, objectivity meant writing a story without putting any personal opinion into it.
Over the last several years, many journalists stopped using “objectivity” in favor of the word “fairness.” Complete objectivity, they reasoned, is impossible. Fairness is more possible. Fairness means that you tell a story in ways that are fair to all sides once all the available information is considered.
Telling a story fairly is more difficult than it sounds. Reporters try to put colorful images and descriptions into their stories. For fresh reporters, especially those working in a second language, it can sometimes be difficult to distinguish between colorful description and editorializing. Some words have a feeling or connotation to them that is hard to recognize. Some English words have “loaded” or “double” meanings that are extremely positive or negative. Writers should be aware of the positive or negative meanings of a word and how its use to affect an article. Also, as human beings, we all have feelings and opinions about events and issues around us—-it is sometimes difficult to conceal those feelings, especially if we feel strongly about something. These feelings sometimes come through in our stories in the words we choose.
Therefore, the TextBlob, a module of python, is designed for pointing out humans’ subjectivity in news.
Package “TextBlob”: Natural Language Processing
TextBlob is a library for natural language processing or NLP.
“Natural Language Processing” is a field at the intersection of computer science, linguistics and artificial intelligence which aims to make the underlying structure of language available to computer programs for analysis and manipulation. It’s a vast and vibrant field with a long history! New research and techniques are being developed constantly.
Natural language processing techniques can give us access to units and aspects of the language that underlie the text (like sentences, parts of speech, phrases, sentiment, etc.). In this case, we mainly focus on the sentiment function.
Sentiment: Polarity and Subjectivity
The TextBlob package for Python is a convenient way to do a lot of Natural Language Processing (NLP) tasks. For example:

This tells us that the English phrase “not a very great calculation” has a polarity of about -0.3, meaning it is slightly negative, and a subjectivity of about 0.6, meaning it is fairly subjective.
TextBlob also handles modifier words! Here’s the summarized record for “very” from the lexicon:

Recognizing “very” as a modifier word, TextBlob will ignore polarity and subjectivity and just use intensity to modify the following word:

The polarity gets maxed out at 1.0, but you can see that subjectivity is also modified by “very” to become ( 0.75 cdot 1.3 = 0.975 ).
Example of China Daily: calculate sentiments
Suppose we are editors from China Daily. We are required to write a report of our news quality in recent months. An important element to measure our news quality should be fairness.So we need to scrape news on the first ten pages of China Daily as the sample through which we can get a basic understanding of all news in general.
First of all, we want to show you the whole codes for your reference.

Step 1: Get text
Suppose we are editors from China Daily. We are required to write a report of our news quality in recent months. An important element to measure our news quality should be fairness. So we use the equation “BeautifulSoup” and “TextBlob” to analyse it.

Import the package we need. requests is a tool to get the response of the website. lxml is a package to interpret the website. csv is the tool to save the file as a specific format.
Then we need to get the response of the first page of China Daily and transfer its codes to BeautifulSoup. Locating a specific position of a category of news in the HTML, for example, latest news. Because its HTML is like the following picture, we need to focus on the website address as “href”. Then find the “a” area and get the address.

Line8: get the response of the web. And define the text as “r”.
Line9: use BeautifulSoup to extract the HTML information, and use lxml to interpret the content.
Line10: use “find to locate the area.
Line11: use find again to locate to a more specific area and get the web.
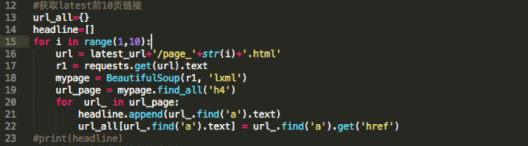
As we need to get the whole 10 pages, so we write a “for” loop. We create an empty dictionary in line13. please ignore the line14 at this stage, who serves for the later write in “csv”.
In the website, clicking “latest”, you will arrive at http://www.chinadaily.com.cn/china/59b8d010a3108c54ed7dfc23, which includes 10 pages of news. If you click the second page of the latest, it will lead to another link http://www.chinadaily.com.cn/china/59b8d010a3108c54ed7dfc23/page_2.html. Pay attention to the format of the website, and you can find a rule. So we can assume that that the following page’s address is like that. See in line 16.
In order to get the title, we write the line19 to locate the area of the title and the website. As there are many “h4” in the HTML, so we use find_all to locate.
Line22, which is also used for “csv”. It uses “append” to add the headline in the list.
Line23 is to add information into the dictionary “url_all”. Every dictionary has a key and a value.
“url_all[url_.find(‘a’).text] ” means we define […..] as the key of the dictionary “url_all”, and define “url_.find(‘a’).get(‘href’)” , the right of the equation, as the value. Those two are both variables.
Step 2: Analyze the text
Now the function TextBlob should be used to analyze the text in the first-ten-pages news.
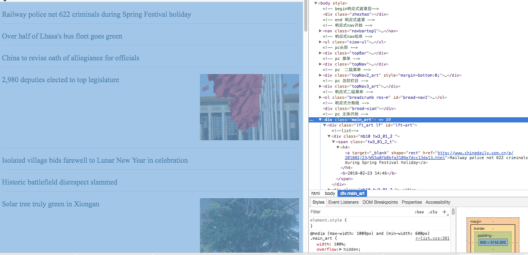
As the HTML is like the above picture, so we have line30.
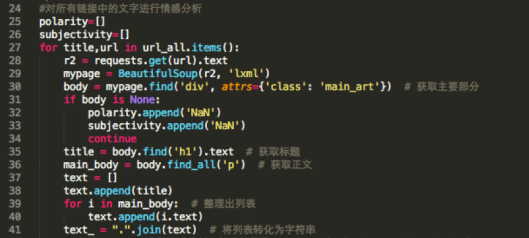
Through line 30, we can locate a large area, which contains the title and content. The aim of this process is to get headline and content conveniently. Thus we don’t have to ‘find’ the headline and content over and over again.
It is easy as there is only one title. But it is difficult to find the body of the news. As we can see in the HTML above, there are many “<p>”s, which mean paragraphs in the body. So we should use a “for” loop.
And there are some empty passages, which only have pictures. So we use “if…continue” to let the title match “NaN”.
Besides, we have to transfer the content in the list into text format, as TextBlob can only analysis text. Line 41 is using “join” function to transfer it. And dot is a separate mark.
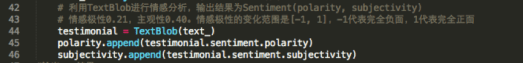
In line 44-46, we use TextBlob to analyze content emotion.
Line44 means, we define [title] as the key and “testimonial.sentiment” as value.
Polarity is to measure the negativity and positivity. “1” means absolutely positive, while “-1” means absolutely negative attitude. Subjectivity is to measure the objectivity quality. “0” means absolutely objective.
As we know, the average polarity is around 0.21, while the average subjectivity is about 0.40. The range of polarity should be within [-1,1], -1 means totally negative and 1 means totally positive.The result in detail shall be shown in phases. Each phase includes one title and one sentiment, which divided by comma.

As we mentioned above, it is impossible to be absolutely objective, that is, the number “0” is just an ideal number. However, by analysis news routinely, we will get more and more sentiment data, which allows us to see the trends whether we are fairer or not. The goal is to bridge the gap between the number you get and “0”.
Step 3: Write the data into csv
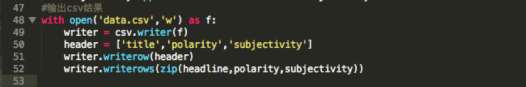
Line48: create a new csv file. Open it by the way of ‘w’ in default. Use f to replace the file’s name.
Line50: create a list.
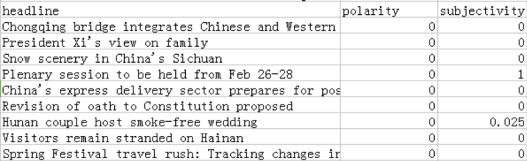
Line51: write the list in excel on the top in a row.
Line52: write the content in a column. In fact, Zip means change every row of the original list.
Step 4: Collecting and analyzing the results
Not all results are referable. Sometimes abnormal condition may happen due to website problems. For example, if a headline emerges on the website page more than one time, the”TextBlob” doesn’t know which one we want to analyze, then the error happened.

Besides, if a news story has no text but photos, the polarity figure usually comes out “0.”
Therefore, the referable news should be 168 out of 178 in the first ten pages.
The range of polarity is[-1,1], the bigger figure, the story more positive and vice versa;
The range of subjectivity is[0,1], the bigger figure, the story more subjective and vice versa.
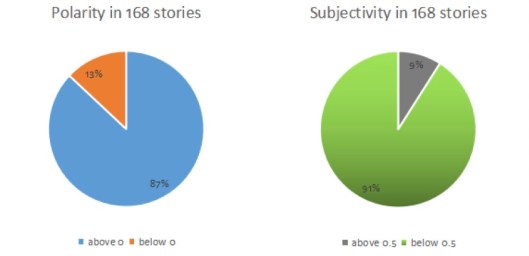
In the first chart, positive news(above 0) accounts for 87%, which largely outnumbered negative news; The second chart tells us the majority of news in China Daily tend to be more objective, with only almost 9% are more subjective.
The collecting data shows the news in China Daily are more likely to be positive and fair.
When it reports about other countries, such as Vietnam and Japan, China Daily tends to show positive things to readers. The 13% negative stories are all about China except for one reports about North Korea.
However, we still cannot simply conclude that the result ’fair’ is real fair because most of the negative stories are not about saying something really bad, but about disasters, thus some obviously negative words, such as death, the injury is unavoidable.
So based on what we have learned so far, we can refer to computer calculation to see the journalistic atmosphere in a certain area or in a certain medium, but the result may not be definitely accurate because some other contributors are also involved in.
By unceasingly studying python, we will have the ability to design a more scientific and systematic computer language to analyze news and collect more reliable data.
Problems You Might Encounter
- Line 1 “#coding=UTF-8” is used to clarify Chinese and English, which can avoid messy code occurred.
- In line 16, we use “ ‘/page_’+str(i) ” as a variable. Because there are 10 pages in the category of latest news.
- In line 19, we find all the ‘h4’, then we use ‘for loop’ to find the one we wanted.
References
- “Objective and Fairness,” English-language news writing, Noonan and Mustain.
- Natural Language with TextBlob, Retrieved from https://aparrish.neocities.org/textblob.html
- Natural Language Basics with TextBlob, by Allison Parrish.Retrieved from http://rwet.decontextualize.com/book/textblob/
- TextBlob Sentiment: Calculating Polarity and Subjectivity.Retrieved from https://planspace.org/20150607-textblob_sentiment/
Codes and data
The complete version can be downloaded here: group2 – ChinaDaily
Notes from lecturer
The major advantage of this group is to learn text mining ahead of our schedule and this is the spirit promoted throughout this course. To learn how to learn is at the core of our agenda. As for the purpose of exercising scraping, the script is not deep enough. The only crawled object is title. A better allocation of efforts would be to crawl more data entries and use primitive ways to analyse the data, just for completeness. For example, one can crawl title, date, author, content and convert them into a list-of-dict structure and store in CSV. It is very easy to run keyword analysis or basic statistics in Excel. Answer a few simple questions already adds much value, e.g. how many articles are posted per day/week? How many times a keyword appeared, say “Xi”, “New norm”, “AI”, “Blockchain”…
As to the sentiment analysis, the analysis process and writing can be improved. First, one need to always note the scope & constraint of the analysis. Here are some natural questions. How many articles are analysed? What is the time frame of those articles? By reading the title, we were expecting a complete content analysis of all the articles in the past decades. It turns out the crawled data was *only the title* of recent *10 pages* of *latest news*. There is no problem of the data volume of this case. We always start small and start simple. However, we need hold the principle of full reporting during the writing process. Such key information needs to appear in the summary.
The last suggestion is not to forget your journalism training. Although we learn Python in this course, you do not have to do everything in Python. A good journalist can find good stories by eye-balling the crawled CSV.
— Pili Hu (Mar 1, 2018)
Author/ JIANG Ting, TANG Jiaping, CAI Jiajing
Editor/ Yucan Xu, Pili Hu
