
Tags
On December 22, 2017, President Trump signed the Tax Cuts and Jobs Act. How does it matter to the companies and citizens?
Tax is one of the crucial parts of the country’s economic. Under the globalization, US tax policy might relevant to your life. The economic trends could affect you and the steps you might need to take so you can profit from it. Moreover, there are lots of data in the tax policies which could turn into some good data news. This week we will share some Trump’s new GOP tax cut plan data news.
What is the Tax Cuts about?
☞Trump’s Tax Plan and How It Affects You [Link]
The whole tax bill cuts the corporate tax rate from 35% to 21% and the top individual tax rate will drop to 37%, which used to be 39.6% in 2017.
The following chart shows the progressive tax rate before and after the bill, in one Table. We find that table is an effective way to display data with high density. It seems the tax will be deducted for everyone except for the lowest income bracket.

Read more: Corporate Income Tax: Definition, History, Effective Rate
☞Who gets a tax cut under the Tax Cuts and Jobs Act? [Link]
The Tax Foundation is the NGO with lots of tax data and related researchers that one could reference. In the following table, 9 sample households are selected and their corresponding tax before and after the bill is calculated:
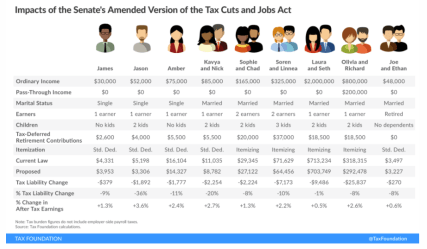
Read more: Overview of the Senate’s Amendment to the Tax Cuts and Jobs Act
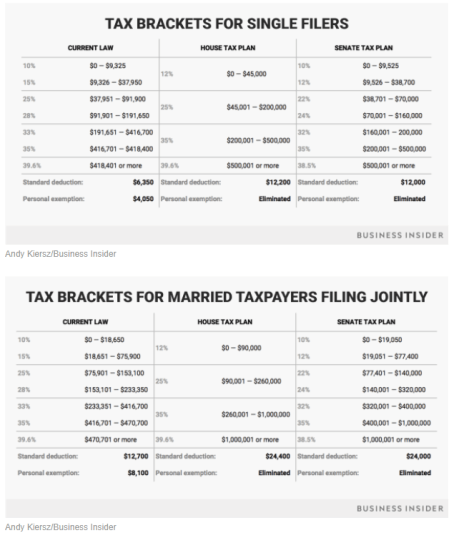
☞Two charts show the difference between House tax plan and Senate tax plan [Link]
As we mentioned above, the table is a normal way to show the data in news. Like the two charts below, one for single, another for the married couples. So we could check which related to us directly.
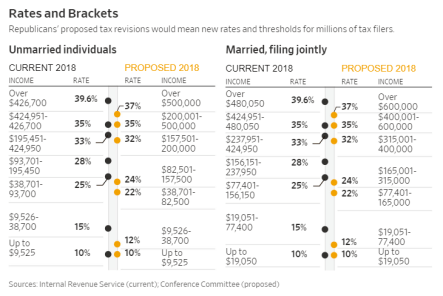
☞GOP Is Poised to Pass Sweeping Tax Overhaul [Link]
The Wall Street Journal also make a chart by two groups: the unmarried individuals and the married, filing jointly:
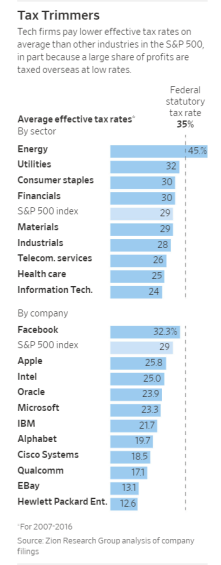
Moreover, WSJ did write Tax Plan Strikes at Tech Giants’ Foreign Profits
“U.S. companies with the lowest tax rates include tech firms such as eBay Inc., Cisco Systems Inc. and Alphabet Inc., whose effective tax rates averaged under 20% over the past decade, filings for all three companies show. Microsoft’s average effective tax rate was 23.3% over the 10-year period through 2016.”
Looks like US companies are beneficial a lot of the tax cuts plan:
What? The richest get richer!
☞Benefits to the wealthy? [Link]
The Washington Post said that The Democrats say President Trump’s tax cuts are a massive giveaway to the rich, the most unequal overhaul of the U.S. tax system in modern history.
To understand the winners and losers, the Washington Post finds out by assembling historical reports about the 10 largest tax cuts of the past 50 years.
Facts check are necessary when you want the readers to get the true information. So after reading the past 50 years tax cuts reports, WP finds out “the Republicans’ $1.4 trillion tax plan isn’t the biggest in history. It’s not even the biggest in the past decade.”
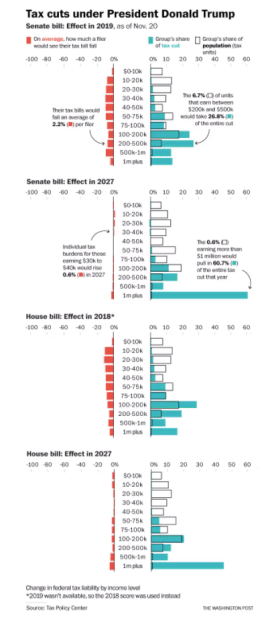
The charts below tell the readers that how much the average tax filer in each group and the House bill effect both in 2018 and 2027.
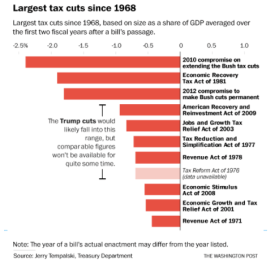
WP also post the bar chart about largest tax cuts since 1968 in the US like below, which shows the tax cuts are not even the most grand in the latest decade:
☞New Youk Times did a little interactive game. [Link]
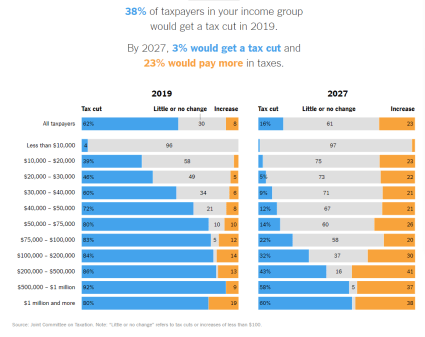
When your choice the income group you belong to you could see the details of your taxation. This is the result if you choose the $10,000 to 20,000.
Although the rich get richer,  NYT did a data visualization to show that millions of children could lose health coverage which insures nearly nine million children in low-income families in the US. ( Read more: Millions of Children Could Lose Health Coverage Starting Next Month ).
Data visualizations help us reflect and rethink the tax bill’s effects on different groups of people.
Data base:
Data News of the Week (DNW) is a weekly issue of news summaries hand picked by our editors. It features a GLOCAL (global+local) perspective for the topic of concern. It tracks the latest developments from the industry and academics for methodology, tools, datasets and news agenda.

What the Tax Bill Would Look Like
for 25,000 Middle-Class Families, By QUOCTRUNG BUI and BEN CASSELMAN NOV. 28, 2017 . NYT. https://www.nytimes.com/interactive/2017/11/28/upshot/what-the-tax-bill-would-look-like-for-25000-middle-class-families.html
This case uses a simulation-based approach: generate household data points using census statistics and then plot all the data points onto a chart. The scatter plot visualises the effects of tax cut and help the readers to identify where the gap is.
LikeLike