
Tags
Summary: We used API (Application Programming Interface) as the source to extract data from the USGS database in order to analyze the last 50 years and estimate the frequency of earthquakes in Southeast Asia. With the help of Python, the extracted data was exported into CSV file for categorizing different parameters such as by country, magnitude and year.
Introduction
Application programming interface (API) is commonly used to extract data from a remote website server. In layman term, API is used to retrieve data or information from another program. There are several websites such as Facebook, the USGS, Twitter, Reddit, which offer web-based API helping get information or data.
In order to retrieve data, we will send requests to the host web server where you want to extract the data and tweak parameters like URL in the module to connect to the server. Different websites have different requests format and can easily be accessed through the host’s website.
In our module, we will be extracting the data of earthquakes that hit Southeast Asia in the last 50 years from the web server of USGS using API.
One of the most frequent natural disasters on planet earth is earthquake. The sharp unleash of energy from Earth’s lithosphere generates seismic waves which lead to sudden shaking of the surface of the Earth. This natural disaster has led to the death of thousands of millions of people all around the world.
The strength of earthquakes is measured through Richter magnitude scale or just magnitude. The magnitude is the scale which ranges from 1-10.
The most highly sensitive region in the world prone to the earthquakes are Southeast Asian countries. To find the trend in the region, we extracted 50 years data from USGS by using API and convert the numbers into CSV file through Python coding for a comprehensive understanding of earthquakes situation in Southeast Asia.
Coding Process
Step 1: Finding the total number of Earthquakes in South East Asia in last 50 years
Part 1:
The principle of using API is to extract the database by changing the parameters of the URL. The URL is the host server address from where the information can be retrieved from, like a search engine. Changing the parameters of it is like changing the keywords for searching.
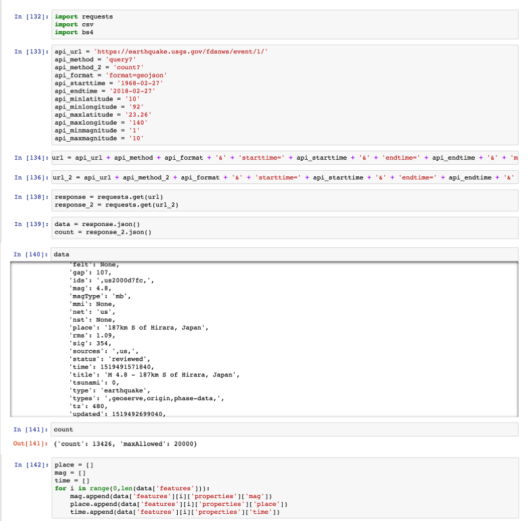
For example, if we need to find out the total number of earthquake ranging from magnitude 4.1 to 6 that took place in Southeast Asia in the past 50 years, we input the URL such as:
“https://earthquake.usgs.gov/fdsnws/event/1/query?(/count?)format=geojson&starttime=1968-02-27&endtime=2018-02-27&minlatitude=10&maxlatitude=23.26&minlongitude=92&maxlongitude=140&minmagnitude=4&maxmagnitude=6”.
This is the USGS website URL which we are using to extract earthquake data. However, we can change the URL parameter to extract data from different websites.
Part 2:
Using the method “query?” is to submit a data request to get a list of each earthquake’s detailed information, including the location, the date, the magnitude, among others.
The method “count?” is to perform a count on a data request. This helps to get the total number of the earthquakes quickly.
Part 3:
We defined the “starttime” as Feb. 27 in 1968 (50 years ago) which means we limit to events on or after this specified start time.
Similarly, we input the “endtime” as Feb. 27 in 2018 (today) which means we limit to events on or before this specified end time. Then we already set a time range of the past 50 years.
This can be changed to put the time series range an individual wants to retrieve data.
Part 4:
In order to input, we need to refer to the map to get the exact latitude and longitude of Southeast Asia. We put the numbers into these four parameters: the “minlatitude” limits to events with a latitude larger than the specified minimum.
These parameters can be tweaked depending on the region from where you want to extract the data.
The “maxlatitude” limits to events with a latitude smaller than the specified maximum, while the “minlongitude” limits to events with a longitude larger than the specified minimum, and the “maxlongitude” limits to events with a longitude smaller than the specified maximum.
Using the parameter in our module, maxmagnitude refers to the information we would extract with earthquake magnitudes less than 10.
Similarly, we input minmagitude at 1 to retrieve data higher than the specified number. Through the inputs in both the parameters, we create a range from 1-10 for collating the data in this range.
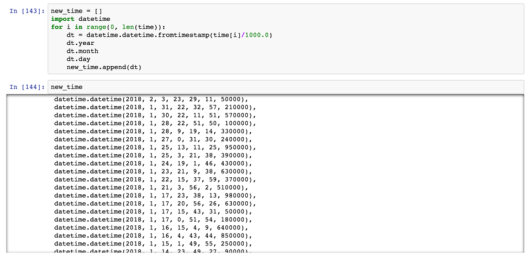
Step 2: Decode data into readable format
Step 3: Exporting data into CSV file

Scales of earthquakes in Last 50 years in Southeast Asia
Through the data collated, we found out that in the last 50 years, Southeast Asia has witnessed 13,426 earthquakes in different magnitudes from 1968-2018.
Furthermore, we categorized the magnitude scale of earthquakes into three ranges, namely 1-4, 4.1-6 and 6.1-10 to under understand the different level of the earthquakes faced in the region.
An astonishing 13,426 total earthquakes experienced in the region in the last 50 years also have an interesting side. Of the total number, 1,272 earthquakes were less than 4 magnitudes which imply that while we have been living our normal busy lives, earthquakes still persists even though we cannot realize its effect.
The major chunk of the 13,426 earthquakes experienced in last 50 years in Southeast Asia was between 4.1 and 6 magnitudes. As many as 11,993 tremors were felt by the people that caused damages to the building and structures but its more prominent effect was felt in populated areas of Southeast Asia especially near the water bodies.
The devastating and life-threatening earthquakes are more than 6.1 magnitudes which have shaken the region 161 times in last 50 years. Due to its strength, several countries especially islands near the epicenter of the earthquake get affected which eventually results in loss of life and property in large numbers.
Earthquake distribution in Southeast Asia
According to United Nation’s World Population Prospectus 2017, the Southeast Asian countries total population is more than 641 million, which accounts for about 8.5 percent of the total population the world and third most populous region in the world after South Asia and East Asia.
The regular occurrence of earthquakes has become a regular feature of the region with the Philippines experiencing the most tremors in whole of Southeast Asian countries in each of the Richter magnitude scale.
In the last 50 years, Philippines encountered 8,238 tremors out of the 13,426, the most by any country in the region. The country has soaked in more than half of the total earthquakes in the region.
The tiny island of Taiwan is the second most earthquakes prone country with 1,621 shakes and Thailand with 67 tremors, while landlocked Laos has registered more earthquakes at 99 compared with Vietnam, which is located on the South China Sea.
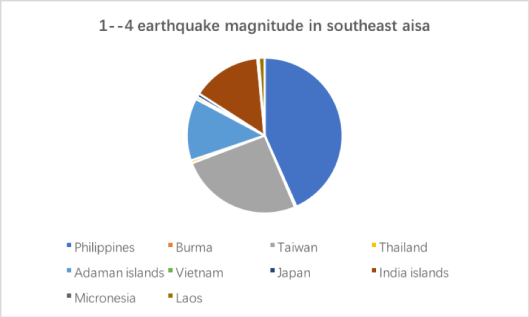
Even weak magnitude earthquakes in the range of 1-4 occur frequently in Southeast Asian countries, with Philippines leading the pact, closely followed by Taiwan, Laos and Vietnam in a similar fashion. Even though people cannot feel the floor shaking but these low magnitudes are taking place quite frequently.
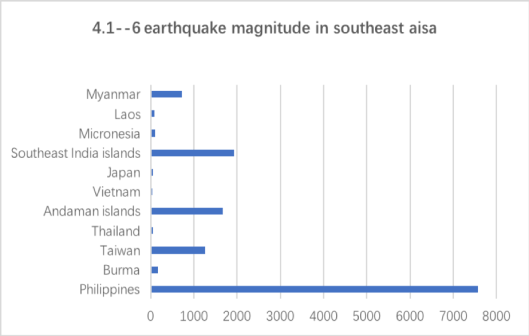
From the below table, we find Philippines leading the way with more than 7,500 earthquakes ranging from 4.1-6 followed by Taiwan with 1,254 tremors, Laos (80) and Vietnam (40).
In terms of major magnitudes, Luzon island in Philippine, the most populous island in the country, faces the most number of earthquakes in the country.
Of the 96 earthquakes with magnitude 61.1 to 10 in Philippines, the island was hit 26 times by severe earthquakes in the last 50 years.
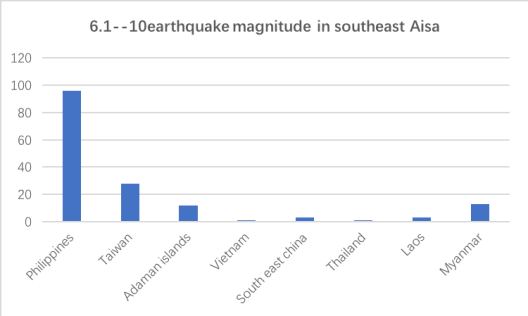
The devastating earthquake has jolted Taiwan and Myanmar with countries recording earthquake 28 and 13 times, respectively, in last 50 years. Interestingly, Thailand and Vietnam have suffered the high magnitude only once.
The region lies at the intersection of different geological plates such as Sunda Plate and Alpide Plate and some Southeast Asian countries fall under the Ring of Fire, an area in the basin of Pacific Ocean where the frequency of earthquakes and volcanic eruptions are the most. Thus, earthquakes are a prominent feature of the region.
Trend in last 50 years
In the last 50 years, there has been fluctuation in the number of earthquakes between 4.1 and 6 magnitudes that have been taking place in the region. Every second year, the number of earthquakes exceeds the figure posted in the previous years.
However, there are years when the number of earthquake decreases for only two consecutive years but is compensated with a higher jump in the third year. There are no instances where the numbers of earthquakes increase for two consecutive years.
Example: In the last 10 year from 2007 to 2017, the number of earthquakes varied each year. However, after 2009 which recorded 304 earthquakes, we found two consecutive years (2010 and 2011) decline in the number of tremors reported in the region but the decrease was compensated with a jump in the third year in 2012 that posted 590 earthquakes.
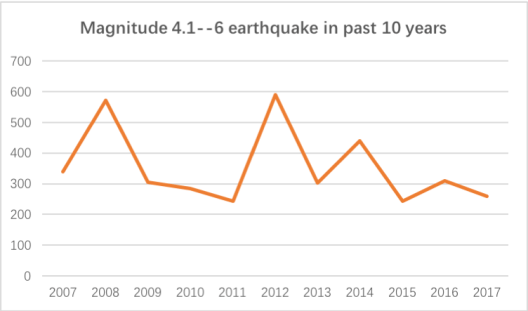
Closely looking at last 5 years, the earthquakes have been increasing and decreasing simultaneously every year. However, the surge every two years is decreasing in percentage terms compared to the last increase.
Through the finding, the number of earthquakes which will be recorded in 2018 would be more than 2017. However, it will be increasing at a decreasing rate compared to the last peak and will follow the highs and lows in near-future.
From the beginning of 2018 till February 26, 2018, the region has felt 55 tremors between magnitude 4.1 and 6 compared with 35 shocks in 2017 in the same period, an increase of about 64 percent.
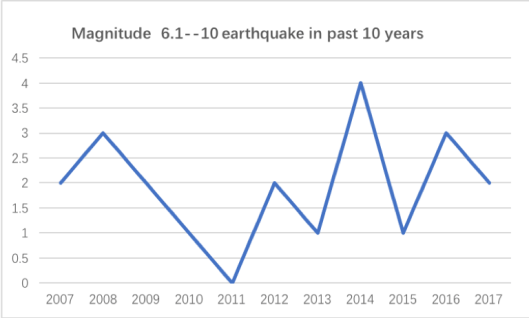
Similarly, for earthquake magnitudes in the range of 6.1-10, the fluctuation every year provides a trend showcasing an increase in the number of earthquakes in 2018 compared with 2017. This back and forth movement will continue in near-future as well.
Codes and data
Interested readers can download codes and data here: goup3 – Earthquakes
Notes from Lecturer
Application Programming Interface can be thought of as a “function on the web”. You give input arguments by sending HTTP request to the server and get the output by parsing the HTTP response. API is useful because it returns structured data and can handle (sometimes heavy duty) calculations during the process. Using the requests.get function is basically emulating the process of typing URL in the address bar of your browser and hit enter. So for most of the APIs, you can simply experiment around with your browser and use requests.get to retrieve the result. For example, click here to get the number of earthquakes in the world that took place during May 12, 2008 and May 13, 2008 whose magnitude is less than 1. And click here to retrieve all the earthquakes during the same time period whose magnitude is above 7, from which we can clearly see the “Great Wenchuan Earthquake” (which is not great at all). By tuning the URL parameters, which appear in the “key=value” form and segmented by “&”, one can ask the USGS backend to run different calculations. It is easy to pin down a region, survey a time frame, or limit the magnitude.
The group used string concatenation to make the full requesting URL. A more efficient and concise way is to use Python format string. Or, one can further pass URL parameters by the arguments of “requests.get” function. This way makes it easier to tune the parameters and do exploration. Checkout an example here.
— Pili Hu (Mar 1, 2018)
Author/ Pragya Bhatnagar, CHEN Qiman, SHI Fangyuan
Editor/ Yucan Xu, Pili Hu
