
Tags
Summary: In this article, we crawl and analyze the top 250 films evaluated by DouBan users, find their preference on specific directors, types and regions, and also see trends of movies in different regions, particularly in America and Hong Kong. Besides, we pay attention to analyze the rise and down of Hong Kong film productions, and also add some background information for a better understanding.
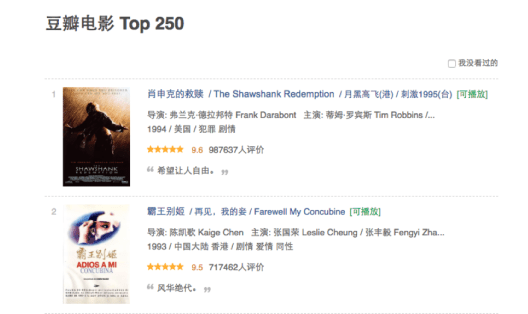
Douban top 250
In general, the best ways to reflect a movie’s preference and prevalence are through box office and ratings. But box office is biased since lots of movies are blocked in China and people are likely to be affected by several factors. Thus, it’s more objective to examine it through ratings.
Douban Movie is a famous Chinese film rating site, with millions of users watching, rating, and commenting on movies day by day. Considering a large number of Douban users and the relatively objective measurement, data from the Top 250 list is suitable for our analysis.
Here are our conclusions based on the data we crawl
1. American directors win Chinese audience’s hearts
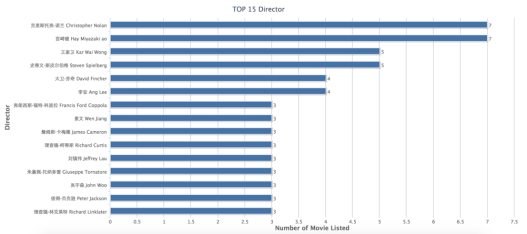
Top 15 Directors of Douban Top 250
Hollywood director Christopher Nolan(诺兰) and Japanese director Hayao Miyazaki (宫崎骏) top the list with 7 selected movie respectively, followed by Chinese director Wong Kar-wai(王家卫)and American director Steven Spielberg, with 5 movies listed respectively. It’s worth noticing that Wong Kar-wai performs best among Chinese filmmakers.
Although it is a rating list rated by Chinese audience, half of the top 10 popular directors are from America, which may illustrate why Hollywood movies dominant Chinese film market.
2. Drama Movie Rocks
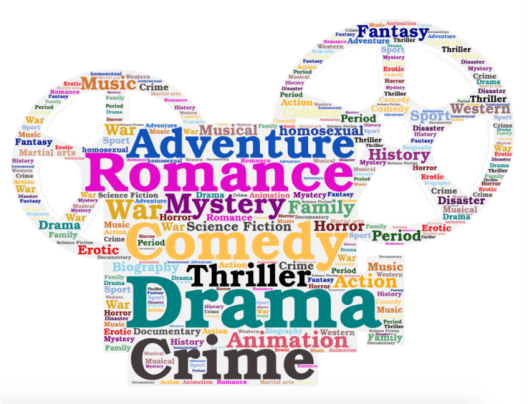
Wordcloud map of different genres
By counting the frequency of each type of movies, the Word Cloud chart below shows that Drama, Romance, Crime and Comedy are the top 4 popular types among Chinese audience. Drama has the highest proportion (30%)among the total 27 types, followed by Romance(9.8%), Crime (6.9%)and Comedy (6.9%).
3. 38% movies on the list are from America
The majority films on the Top 250 list are produced in America (38.1%), which again reflects the popularity of the Hollywood industry. Besides, among Chinese-language movies, Hong Kong movie has the highest ratios of 6.9%,higher than ratios of Mainland China (4.3%) and Taiwan(1.8%).
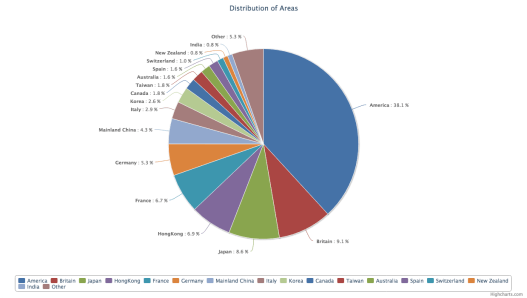
Area distribution of Douban top 250
4. A Rather Popular List
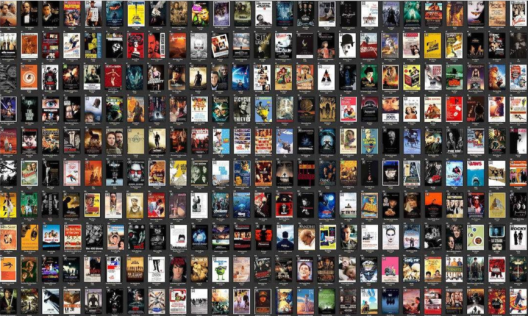
Film posters of Douban top 250
Many audiences regard Douban as a playground for artistic groups, with a preference for literary films. However, the figures show that over 80 percent of the top 15 directors are commercial directors, who have high achievements on box office and the distribution of area centralize in America where thousands of commercial blockbusters are produced every year. Thus, Douban Top 250 list is not as artistic as people predict.
5. Amir Khan is most popular Indian movie star for Doubaners

Amir Khan
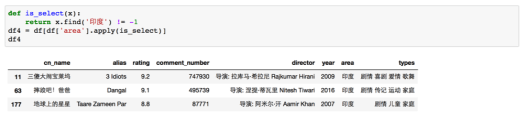
Due to the great box office performance of Indian films in the Chinese market in recent years, we list the Indian films from the top 250 list. The figures show that there are three films on the list, Dangal, 3 idiot and Taare Tameen Par. Although only 3 films were selected, their ratings are all over the average score (8.78). It’s interesting that these movies are either directed or starred by Indian movie star Amir Khan.
6. The trend of Global Industry and Hollywood
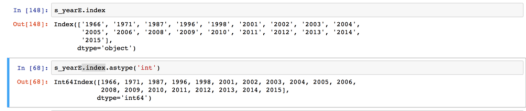
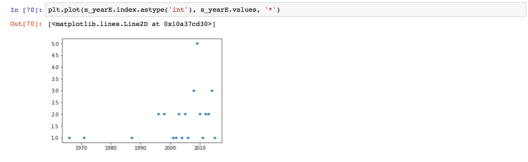
Actually, the Top 250 list can tell more information about the whole film industry and the difference between different regions. Counting the times of “year”, and then extracting the index of “year” and value of “year”, we can plot data into a line graph.
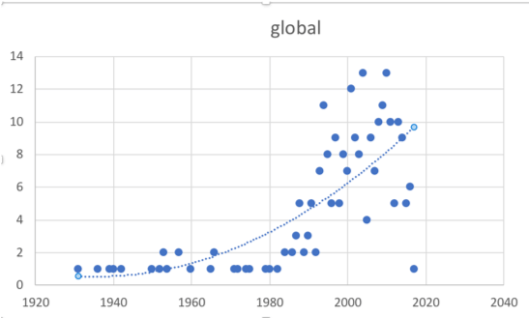
Global trend of movies listed in top 250
As the graph shows, after the 1990s, the production of high-scored films has risen. the golden years of film industry are 2004 (13 selected films), 2010 (13 selected films), 2001 (12 selected films), and 1994 (11 selected films), which accounts for 19.6% of the total ranking. Some famous movies such as Shawshank’s Redemption (《肖申克的救赎》), Forrest Gump(《阿甘正传》 ) are from Hollywood, and some classics Hong Kong movies, like Westward Journey(《大话西游》), are also produced during this era. The trend of American movie is similar which illustrates the dominating status of Hollywood in global market again.
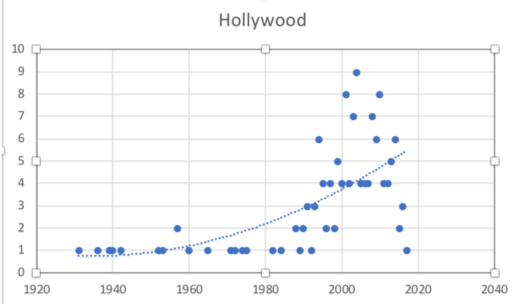
Trend of Hollywood movies listed in top 250
It is worth noticing that the figures of high rating film fall during the time from 2016 to 2017 in global market including Hollywood, but it’s too early to say there are less good movies produced during this period because rating and comments of a movie need to be accumulated with time.
7. The trend of Chinese Film
The movie Heroic Character (英雄本色)directed by John Woo is of great significance to Hong Kong films, which opened the golden age of Hong Kong film industry. It is also the first Hong Kong movie (produced in 1986) appearing on the Top 250 list. You can witness the prosperity of Hong Kong film industry during this period. From the end of the 1980s to the 1990s is the golden age of Hong Kong movies, with 16 Hong Kong movies produced in this period appearing on the list.
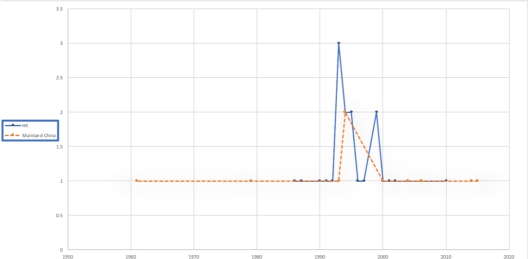
Trend of Chinese Film listed in top 250
In the late 1990s, Hong Kong movies began to decline due to the financial crisis and Hollywood blockbusters. You can also witness this decline when viewing the data. In 2010, there is only one Hong Kong movie called The Year of God(《岁月神偷》)listed, which is the last Hong Kong movie appearing ion the top 250 list. From 2010 to 2017, HongKong films completely disappeared from the list.
Although the total numbers of movies from mainland China (11)are only half of Hong Kong’s(22), it is constant appearing on the list. there are two mainland China movies, Twenty-Two (《二十二》) and The Coffin in the Mountain (《心迷宫》) got listed in 2015 and 2014.
If you want to find the most reputational Chinese movies, the following picture with more details can probably give you some recommendations.
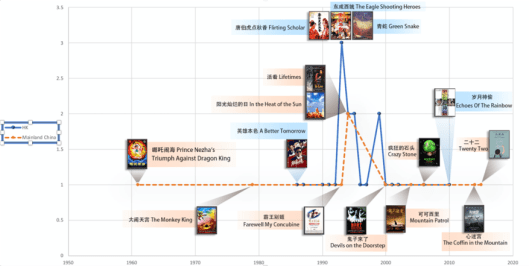
Year distribution of Chineses movies in top 250
Tips
1. Cleaning Data
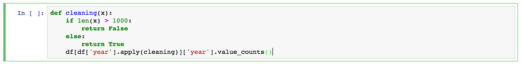
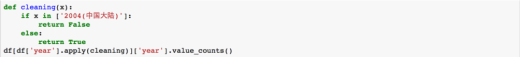
During the process of crawling and analyzing data, we were suffering from dirty data and we always try to clean it as possible as we can. Bear that in mind that, in many cases, dirty data will not be cleared at once. If you encounter dirty data again when using pandas to analyze data, please do not feel discouraged and just remove it again. The following are different two ways that we cleaning our dirty data’2004(中国大陆)’.
2. Transform ‘str’ to ‘float’ or ‘int’
Usually, When you extract a group of data from a data frame by Pandas, the format of the data you get is ‘str’. If the figure is composed by a group of str discrete figures(like years), you need to convert it into ‘float’ or ‘int’ format when using Matplotlib to plot a chart, so that the module can recognize it and count it into a correct distance on axis.
3. Using “jieba” to separate Chinese words
Since the types of every single movie is multiple, and we want to count the times of every type, we use “jieba” to cut it into single words.
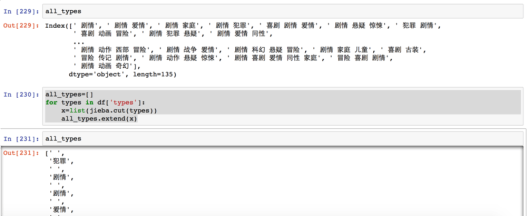
And then removing undesired blanks.
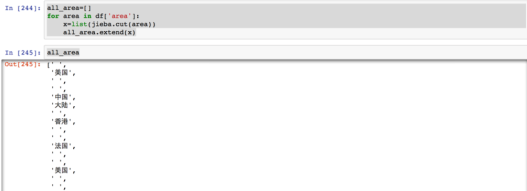
However, there are some problems when cutting “area”. “jieba” cut “中国大陆” into “中国” and“大陆” automatically, which are the same area in Douban, so one of the values is removed when analyzing data.

4. Tools for data visualization
- Word Art—a free word cloud chart online production website. Original figures can be imported as arbitrary text, CSV format or Excel format.
- JS Charts Maker—a free chart online production website, can help make and generate graphs, line charts, histograms, pie charts, histograms, etc. Support for copying and pasting directly from Excel table.
- Excel—in this case, scatter charts and line charts are made by Excel which can plot graphs, line charts, histograms, pie charts, histograms as well.
- Photoshop— can help label the important point on charts to make data more visual
Codes and data
Interested readers can download codes and data here: Douban Top 250 (only scraping and processing part; most visualisation done outside Python)
Notes from Lecturer
This work is a good demo of combining multiple tools to solve problems. After doing the scraping and preprocessing in Python, they switched to other non-Python tools for most of the analysis and visualisation. Tremendous effort is spent to make rich presentations. While we just started learning basic table manipulation and there are not enough tools for analysis, we can spend more energy in visualisation.
First and foremost is to unify the style. Consider color theme, font family, font weight, spacing, …
Second are some details.
For section 1, in the chart of top 15 directors, one can highlight the “American directors” in different colour. That makes the point more clear.
For section 3, it is better to group small values into “other” or larger category. Too many wedges makes it difficult to identify which item it is. This is especially true when color theme does not support that many categories. For example, “Taiwan” and “Spain” are in the same color (red).
For section 6, one can experiment adjusting bucket, say per 5 years or per 10 years (decade). The trend may be more robust when looking at a higher level than individual year, because the production time for movie is on a year basis.
For section 7, there are several points to note for the first figure. Since the basic unit of movie is 1, there is need to add 0.5 to axis ticks. It is also not suggested to add grid lines which usually hints that some data points are potentially there. The selection of line chart is suboptimal. Area chart can better indicate the concerned data is the quantity below the curve. Depending on what stories to tell, one can try cumulative version.
— Pili Hu (Mar 15, 2018)
Author/ Liu Wanyin, Guo Peishan, Fang Ying
Editor/ Yucan Xu, Pili Hu
