
Tags
BY Ann Li, Theresa Yan, Nancy Ping
Choi is a 56 years old mother of two. Although she worked industriously for decades, she still felt difficult to maintain her family. “There is no employment protection for cleaning workers”, said Choi.
Choi was hired by a cleaning company as an outsourced worker, working more than 10 hours a day. Though she worked hard every day while suffered from serious health condition, she earned about HK$5,000 per month, which is under the poverty line set by the Hong Kong government. Because of the heavy workload, she also suffered from the pains of the stiffened knees. However, she still needed to face the situation where the employer deducted her holidays and salaries, she felt anxious to her life.
In Hong Kong, there are over 330,000 workers whose monthly income is less than HK$6,000, according to Hong Kong Commission on Poverty.
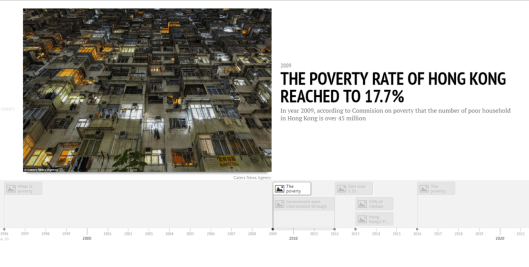
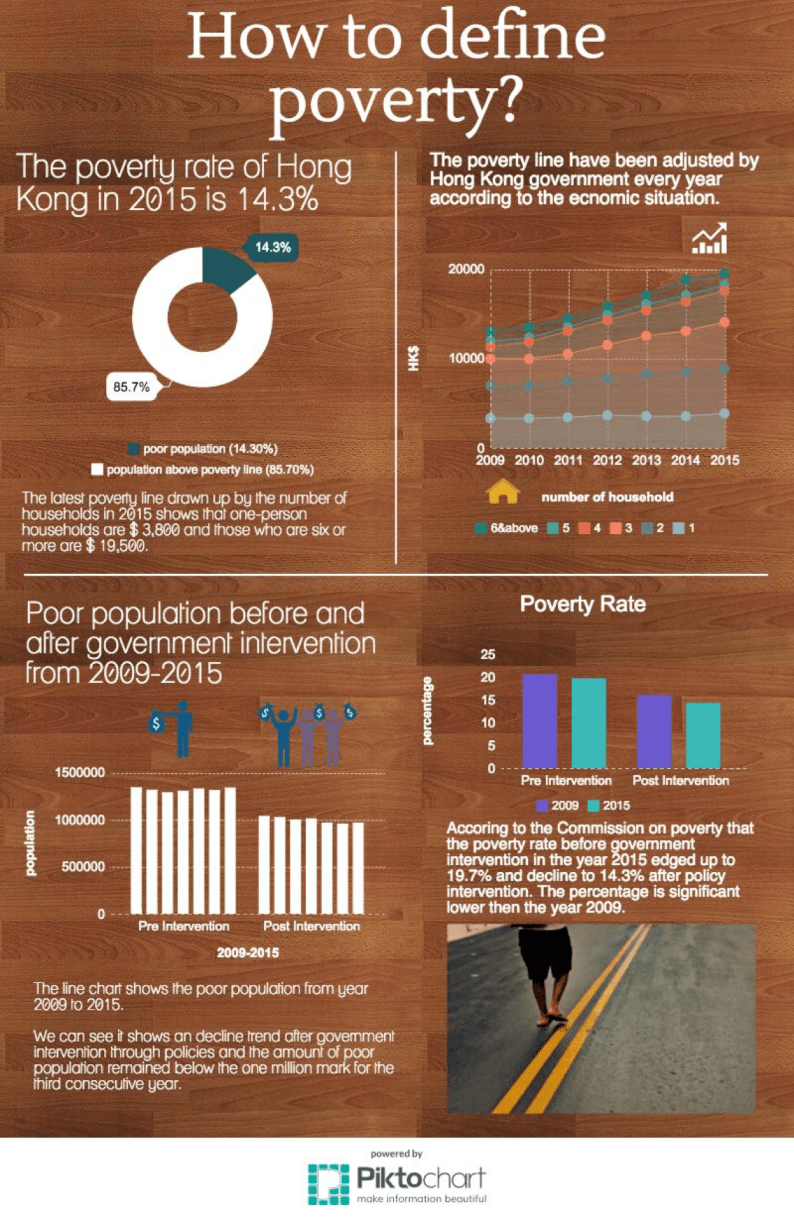
Hong Kong has severe poverty problem. In 2015, the poverty rate was 14.3%. However, the poor population has already achieved 1.34 million, which became the highest from 2010.
The official definition of the poverty line is the half of the median monthly household income of all domestic households in Hong Kong.The poverty line has been adjusted by the government to fit the economic inflation to remain objective. In 2015, the poverty line for the household of 3 people was 14,000.
(Link)
Poverty Situation-colors tell you the truth
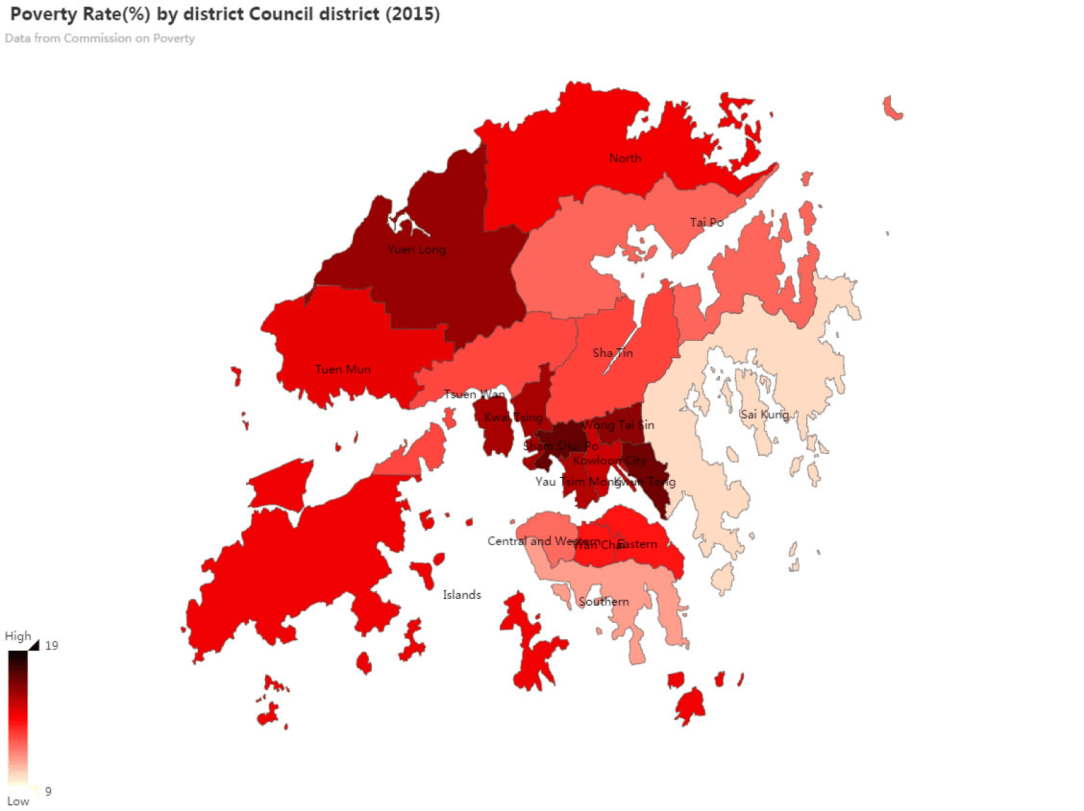
Bearing with a yawning wealth gap in the Hong Kong society, poor people find it harder to cope with the soaring expenditure in their daily lives. In comparison with the 0.469 in the U.S and 0.482 in the Singapore, the Hong Kong’s Gini Coefficient reached 0.537, which indicates the rising income inequality among the citizens, according to the latest census from Hong Kong Census and Statistics Department. However, when we look further into the general poverty situation in Hong Kong, the poverty map helps us to understand the dispersed distributions of the poverty population in the city.
(Link)
Hong Kong now has 18 districts with 7.188 million people, but the poverty rates vary differently among them. When we adjust the scale of the map to the top, we find that there are two districts covered with deepest red – Sham Shui Po and Kwun Tong. Compared with the poverty rate of 17% in Sham Shui Po, Kwun Tong has the second highest poverty rate of 16.8% with the highest percentage of new arrival households.
Hong Kong is a multicultural society. However, according to Hong Kong Poverty Situation Report, most of the people from new arrival households engage in lower-skilled jobs and have relatively low incomes.
In 2015, 52.8% of the new-arrival poor households resided in public rental housing (PRH), and many of them lived in the Kwun Tong district. Indeed, over half of poor households resident in Kwun Tong district live in the public rental housing while only 26.6% of them have private houses.
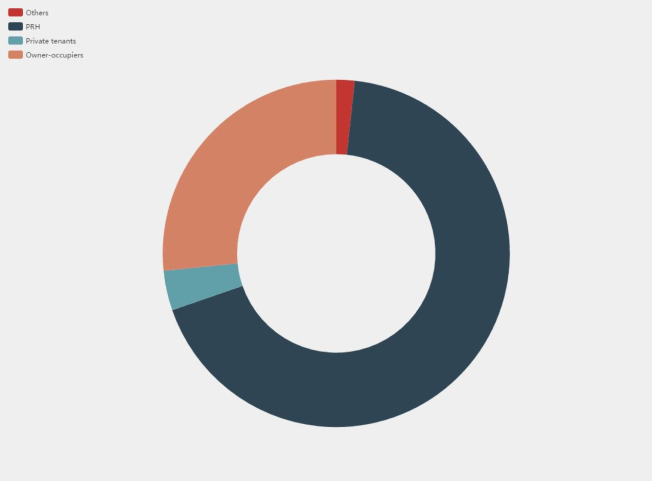
Poor Household-Housing Characteristics of Kwun Tong District

Poor Household-Housing Characteristics of Sai Kung District
However, having the poverty rate of only 9.7%, the lowest among all districts, Sai Kung district has very different housing characteristics to Kung Tong, and owner-occupier households take up over half of the all households, which means that more people have private houses instead of living in public rental housing.

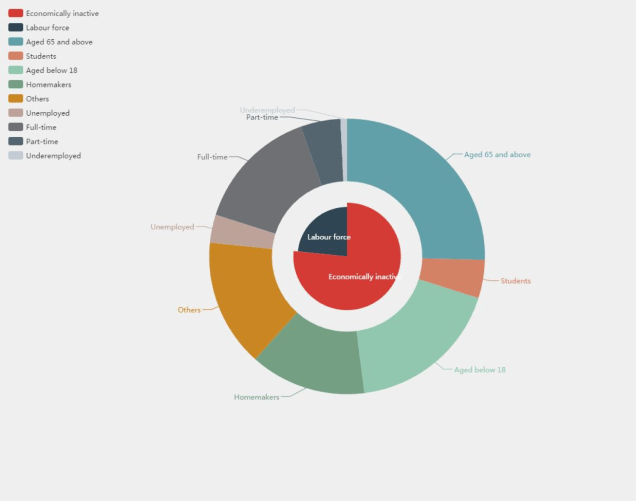
Poor Population-Economic Activity Status of Kung Tong
Poor Population-Economic Activity Status of Sai Kung
In terms of the economic activity status of the poor population, compared with Sai Kung district, Kung Tong district has less working poor population and more economically inactive population. For example, the percentages of poor elderly population in Kung Tong district and Sai Kung district are 29.33% and 25.4% respectively.
Among the total poor population in the Kung Tong district, the working poor take up 21.5%, which means that one fifth of the poor population are actually employed. Choi is one of the impoverished people who works hard to support their families, however, even though they work 10 hours a day, their earnings still lay below the poverty line. The problem of working poor is also very serious in Sai Kung district with the rate of 23.4%.
No matter of the districts with the high or low poverty rate, the working poor problems are very serious, and they are able to work but still live in poverty.
The role of the government – after policy intervention

(Link)
In 2015, Poverty rate before and after government intervention were 19.7% and 14.3% respectively, which are similar to the 19.6% and 14.3% in 2014. Nevertheless, compared with the amount of impoverished people, there were 971 million impoverished people in 2015, which is higher than the number of 963 million people in 2014.

(Link)
According to the Hong Kong Poverty Situation Report 2015, there is one probable reason to answer the question why poor population has been increasing over years, which is the problem of aging population. The aging population has been increasing over years, which becomes a hindrance of the constant decline in the poverty population and further aggravates the problem of elder poverty and even overall poverty situation.

(Link)
The aging population offsets the effectiveness of the government intervention, but it also reveals the weakness of evaluating system by taking the income as the only benchmark. Since some retired elders don’t have regular income but have enough saving and property, the number of impoverished elders can be miscounted.
Because of the deviation in the total poor population, we can examine the effectiveness of the government intervention from the data of different social groups.

(Link)
CSSA and Elderly households suffered greatly from financial problems with poverty rate of 96.5% and 71.6% respectively. Single-parent households also faced serious poverty problems with the poverty rate of nearly 50%. But after official intervention, the poverty situation was alleviated, and the poverty rate of all social groups are below 50%.
Hong Kong government tries to maintain the poverty rate in a consistent level, the general trend of poverty rates after government intervention (recurrent cash) is declining. Poverty is still a serious problem for the Hong Kong society. How to alleviate the problem and benefit the real needy, the government needs to think more of it.

Pingback: At a glance: Hong Kong poverty situation – nancypingping
Two questions are here in its data source and visualization.
1. The contrast of poor population is hard to understand at first sight because nothing suggests me how the year number, which is strengthened in the title, is hidden. Then I know the author grouped the data by before and after policy intervention. But then comes the question: what’s the government’s policy anyway? It’s not mentioned throughout the whole report. More important is how the two different numbers for the same year come out. How do they precisely classify and calculate the poverty population before and after government’s policy? Are the numbers calculated, or estimated? It confuses me.
2. Another question is about the poverty rate graph. It compares two time points, but the trend is missing, so we don’t know whether the drop in poverty rate is a consequence or just a lucky, sudden drop. Maybe we have to compare the two graphs at the bottom ourselves to make the conclusion more persuasive and coherent in our minds.
The questions are not difficult to solve anyway. For the population graph, set a rule that when the mouse hovers on each of the bar, along with the number shows the year, and add a hint of this under the chart. For the poverty rate, either do all the seven years again like the population graph or add a line chart to help show the trend.
Last but not least, say more about the policy itself and the data source.
LikeLike