
Tags
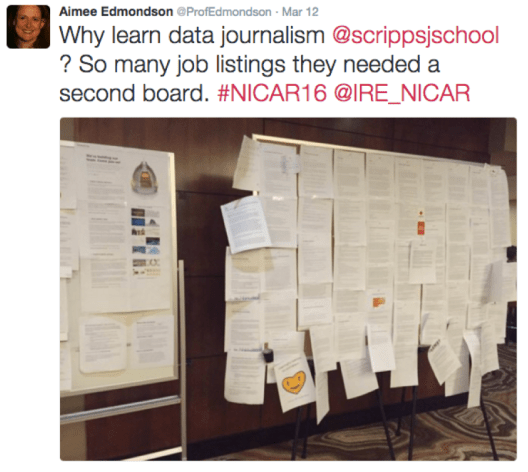
Aimee Edmondson is now an Associate Professor with Scripps School of Journalism, Ohio University. HKBU students are very lucky to have this knowledgeable and passionate speaker to talk about data journalism this afternoon. Her 12 years in reporting and later acquired statistics and technology are a fine combination for a data journalist. In the world where people are too fascinated by new technology and numerous boot camps are created by non-journalists, Aimee can be a role model for those “traditional journalists” who are moving in this direction.
Why does data matter? In Aimee’s words, you want to be a reporter, not a repeater. Data helps one to verify what the source is saying and find out what is really happening. To be pragmatic, we are seeing more and more JD requiring data analytics skills from investigative reporters. Going beyond the journalism domain, the skills trained by data journalism can well fit into corporate communication, public relation and advertising industry.
To start, one only needs to work on “small data”, with a spreadsheet.
Learn spreadsheet to mine the data
Once you learn spreadsheet software, e.g. Excel, Google Spreadsheet, you can already mine a lot of stories from the data set. You do not have to wait for a data scientist to finish fancy data analysis before looking for insights.
Mark Knoller, who is specialised in covering White House, organised a spreadsheet of president trips on Air Force One for past 30 years. It turns out while Trump complained former presidents a lot of golf playing on public budget, he does no less during the same period. The finding was straightforward and got a lot of citation by other White House correspondents from mainstream media. That said, if one endeavour to do the dirty work by organising spreadsheet manually, the even small dataset can spark on new story ideas. One does not need to learn ER diagram, normalisation or Relational Algebra to work on a database.
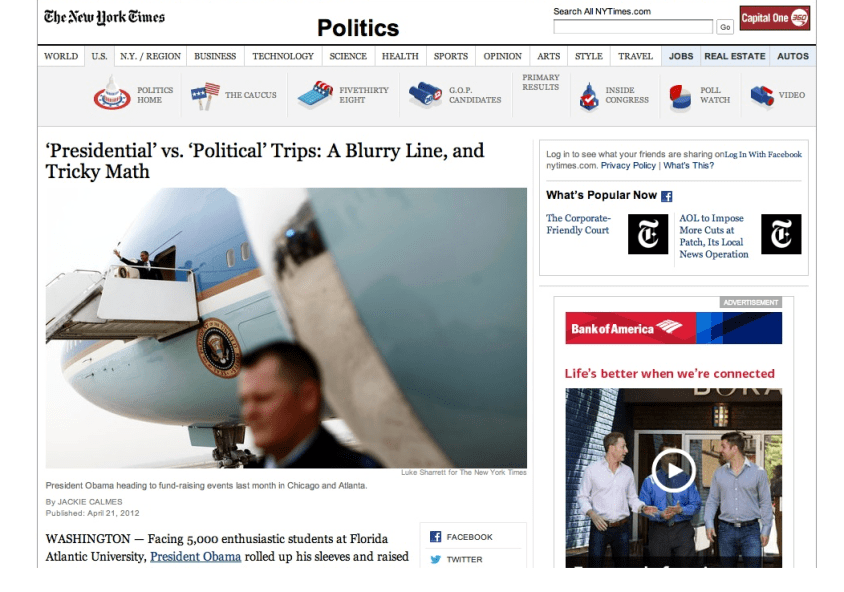
Screenshot: the story from Air Force One trips dataset, case from slides
Another example is the prototype of movie Spotlight — Boston Globe, the Pulitzer winner, used a spreadsheet to process the harassment dataset. It’s said that the team used a simple “sort” operation to find the pattern and then conducted the interviews. Recall the four key operations for a pivot table: filter, grouping, aggregation, sorting. The four pillars make most of the real world analysis and are a frequently used subset of SQL. “Sorting” has the “side-effect” of “Grouping”. For those who have a sharp sense for news, scrolling down a sorted table is enough to find many stories.
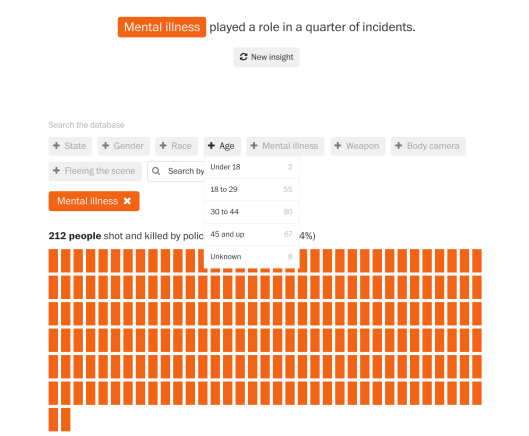
Screenshot: Washington Post, Fatal Force
Washington Post maintains a database of people that got shot and killed by the police since 2016. The numbers keep increasing every time you revisit this site. It has only 891 data points as of this writing but people had already done many stories on it. The complete dataset is also free to download on GitHub — the once “Facebook for programmers” but now “hub of open access for everyone”. GitHub is easy to use and have been the de facto standard for data journalism educators, like Lede Program from Columbia. The JOUR2106 course in HKBU also used GitHub as the hosting/ exercising/ sharing platform for course materials and student projects. It’s noteworthy that the JOUR2106 site itself is made by one journalism student from the class who had no coding experience or web knowledge before.
As a seasoned educator at Ohio University, Aimee spent a lot of energy to make the student interested in this subject. What I learned is to find the nearby cases that the students feel attached to. It takes time but will definitely be our focus on the future iterations of the class materials. The star dataset that attracted much interest of the students is a big spreadsheet composed of 3900 salary records of the Ohio University. Public universities in the US all disclose salary records with employee demographic information, which serves as a good starting point with spreadsheet tricks. In the Ohio University case, they found “basketball coaches make more money than president” by sorting. They found “average women make 10-15K less than men” by grouping and AVERAGE formula. They also found a person who worked at this university for 60 years by sorting, which led to a good feature story.
Want data? Ask loud and search strategically
Data is so precious but not always readily available.
In the Ohio University employee salary case, one journalist tried to ask the University of such records, resulting in a spreadsheet with only name and salary information while other demographics and position information are all stripped in its entirety. Then the poor journalist spent months of efforts searching the university website enrich this table. Knowing to ask for the “entire dataset” is very important and involves negotiation strategy and domain knowledge. Same story happened when we tried to apply FOI request in Hong Kong. Asking for the “entire dataset” is an unknown unknown problem, and dead-end most of the time.
The book “The Art of Access”, by David Cuillier and Charles N. Davis, is a good read for anyone who wants to learn the Freedom of Information Act and apply it in the investigations. Government is a rich body of data source but how to squeeze the juice is an art that needs experience and exercise.
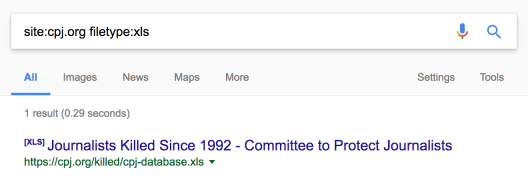
Screenshot: Advanced Google Search to dig out data files on a specific website
When people don’t give you the data and you have not made up mind to build your own, it is good to search around, strategically. When Chris, a photojournalist, was killed Lybia, Aimee led the students to investigate using data. A related dataset is on the Committee to Protect Journalists, but normal web navigation only leads to visual presentations, i.e. a lot of charts and maps. Aimee holds the belief that “when you see many drop-down options, there has to be a spreadsheet in the background”. If you are lucky enough, a simple Google advanced search will lead you to the gold mine:
site:cpj.org filetype:xls
(The “site:” and “filetype:” are Google advanced search operators and they already explain themselves).
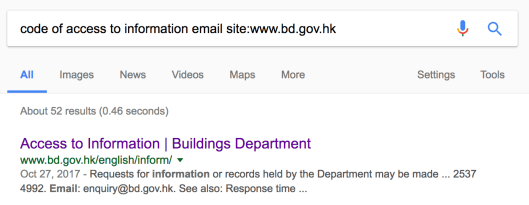
We can spend a whole day on Google tricks, but searching strategically is more a problem of domain knowledge than technical skill. For example, “Clery Act” was signed in the 1990s to enforce universities in the US to collect and disclose campus safety data. A Google search of “Clery Act” plus any university name can take one of the relevant pages. The keywords “Clery Act” are from domain knowledge, or one does not know what to search. Give another example of Hong Kong’s equivalence/ alternative of FOIA. If you know there is a “Code of Access to Information” and every government departments need to display the officer’s contact online, then you can Google “code of access to information email site:” followed by the department website.

Bonus: If you know there is something called “data visualisation photography”, a Google search can lead to you numerous examples of data visualisation without graphics skills.
Journalist’s struggling with tools gradually alleviated
It quickly caught my attention when Aimee suggested the book “The Art of Access” and described it as “by journalist and for journalist”. This “by… and for…” formula recently showed up quite a lot in my short career in this field. On the GIJC17 conference last week, Denise Malan described Tabula, a popular PDF extracting tool, using this “by… and for…” formula. I also heard people describing DataWrapper in a similar way, upon Gregor Aisch (former NYT Graphics) and Lisa Charlotte Rost (former NPR Visuals) recently joined it.
It is apparent that journalists are struggling with tools, ranging from technical, legal to economic and financial. However, journalists have long been known as fast learners. With the proliferation of Internet-based communities and movements towards open knowledge, more learning resources are available in the free license. Besides self-learning using these resources, one will also find more and more tools that are made by-and-for journalists.
I can see that data crunching ability will become a default component of a journalist in the future. As Justin Arenstein, a seasoned investigative journalist in Africa and founder of Code for Africa, put “20 years ago, photography was a technical job conducted by special occupation”. It was hard for people then to imagine what smartphone could perform nowadays and suddenly turn everyone into sort of citizen journalist — research shows that people more likely to believe a news when photos or video clips are taken by their own social network. Imagine one day, computation, storage and network become so cheap that hi-fi 360 light-field videos can be real-time streamed to the world — you do not need to worry about angles and focus on the field — the audience can choose their own but editor picks still work best for the majority. It is the same situation for data today as photo 20 years ago. If you didn’t feel the thing is coming, try IBM Watson Analytics, upload a dataset and type in a question in natural language.
A formula for data-driven journalism: Pattern recognition and anomaly detection
One key question Dr Xinzhi Zhang raised in the end of the seminar is the different approaches in social science research and news mining processes. Social science researchers usually look for trends, or patterns, or something common/ frequent in layman’s words. However, news mining processes usually involve extensive searching for extreme values — recall the Ohio University salary case in the first section of this note.
In my lectures, I usually bring up the data science terms called “pattern recognition” and “anomaly detection” which are like two sides of a coin.
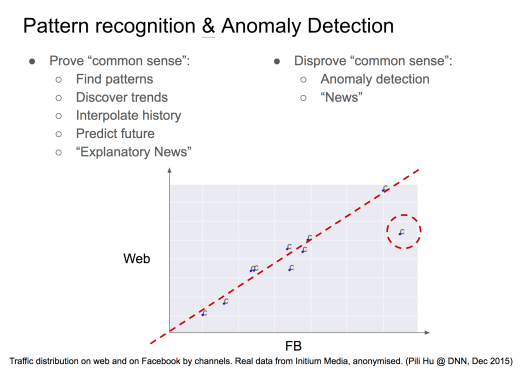
Here is a real-life example of traffic correlation between Facebook engagements and website visitors. If we plot all the channels on this two-dimensional graph, a linear correlation shows up immediately. Then we get the first story: the more Facebook engagements one have, the more website visitors one get. This story is deemed common knowledge by those who work in growth marketing domain, or even common knowledge for an average reader. Finding pattern has a good chance to result in such “common knowledge” and common knowledge is not regarded as news in a narrow sense. If we move away from the pattern and focus on the outliers, or anomaly data points, something interesting appears. There is one channel which has the considerable large amount of Facebook engagements but relatively fewer website visitors. That is a piece of news we discovered from data and narrate with a bit background: Taiwan readers are more likely to interact with content on Facebook than clicking through to the website (for complete article), compared with Hong Kong and mainland China readers.
Status quo of education
Data journalism education is at an early stage. It is said that there are only 13 universities in the mainland that offer data journalism programs. In the US, only 59 out of 113 accredited journalism programs offer data journalism programs.
Are journalism department co-located with PR department in the universities? In the US, only 2 schools offer the two programs separately. Most schools train PR students together with journalism students first and then fork, for example in the 3rd/ 4th year, to different specialisations. This is especially important in the data era, where the skills learned from data journalism curriculum can be very powerful in other domains like public relations, corporate communication and digital advertising. That journalism ethics training bears the good wishes of all educators.
Something confused me when I first entered this area: Almost all Data Journalism (DJ) introduction courses mention Computer-Assisted Reporting (CAR) and Precision Journalism (PJ). For people working in Internet Technology sector, time is too limited to care about history. Everyone works tirelessly to make a history — see how fast the ICT industry revolutionised in past 20 years. Also, we are used to witnessing umbrella terms become different things when successfully commercialised, e.g. “cloud computing”, “big data” and “artificial intelligence”.
When I check the syllabus against typical CAR and PJ, I find a good overlapping with CAR especially about data collection/ management and little overlapping with PJ which is more demanding in statistics. The incremental part of DJ is mainly modern visualisation techniques enabled by many off-the-shelf tools. Aimee’s comment reminded me of the importance of history: “Journalism is not an occupation but it is a calling”. If one wants to avoid the childish notion of journalism, learning the history is a must. Based on my short exposure in this area, I find the root of DJ is not CAR or PJ. Instead, it is Investigative Journalism (IJ) — both an umbrella term that refers to method/ content/ format and at the same time a prestigious occupation in the journalism industry. I refer to it as an occupation because David Cay Johnston said in the keynote of GIJC17 ( https://gijc2017.org/ ), “This (Investigative Journalist) is the only occupation in the world that is paid to tell the truth”. Data is the basis of truth. The correct methodology and ethical presentation/ interpretation/ narrative is the basis of truth-telling. We teach story-telling but need to bear in mind truth-telling is the initial calling.
An ancient Chinese definition of “teacher” come to my mind: 傳道、授業、解惑. I don’t know how to translate it so feel free to leave your comments and help non-Chinese readers.
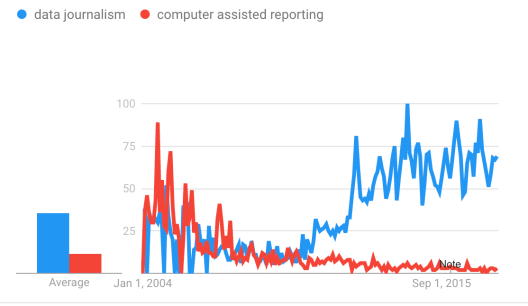
The first pillar of a teacher, a.k.a. “Tao”, is *important* when data journalism was becoming buzzwords with a jump in 2013, and *crucial* when the market of eyeballs is saturated as one can tell from a flattened search interest in recent 2 years. We are going to train way more data journalists than the job openings exist in the market. Many of our students will inevitably end in non-journalism jobs. Job titles, skills and tools all change. However, “Tao” is invariant and I think Investigative Journalism is at the core.
For those who would like to look at more details in Google trends from Nov 2007 to Nov 2017: “investigative journalism” remains the top and keeps a constant search interest, “data journalism” jumped in 2013 and stayed steady ever since, “computer-assisted reporting” is not much discussed outside the US.
Student takeaways
We have a full table of students in the seminar. Students, in general, appreciated the power of data for story discovery. They were convinced of the market demand and made up mind “to adapt and survive”. They were also impressed by the cases and simple methods leading to big news.
Yutong Wang: One does not need to learn programming to become a data journalist [Edited]
Data journalism is not difficult. We are working as a reporter, not a programmer. Admittedly, we do need to understand coding, but we needn’t be as proficient as a programmer. Thereare also lots of online websites for us to learn effectively. We are supposed to grow in a “T”-shape. That means we are better off to have comprehensive knowledge and explore a few directions in depth.
Lin Gu: The bespoke dataset and curated dataset lead to exclusive stories [Edited]
The methods of data collection and analysis interest me most. “If you can’t find any relevant dataset, make your own”. She introduced Mark Knoller to us, who is a journalist with CBS and famous for the reports on the White House. Mark marked down every time Barack Obama plays golf by tracking the president airplane, to show the “poor” working position of the president(s) of United States. She used the raw data of annual income of Ohio University, which she currently holds a position in to show how to approach a dataset from any possible angles may be enlightening. All these are done in Excel.
Bonnie Yu: We have not yet used simple tools to the full extent [Edited]
She mentioned some organizations (editor note: IRE for example) offering data journalist training or holding some summits which are brand new to me and seem amazing. I hope to attend some of them in the future. The most impressive part for me is the analysis of her cases, especially the use of Excel in various ways and the analysis of Ohio University staffs. Actually, I started using Excel ever since the time I started using computer but I never used the tool to the fullest extent. The collection of the data tells the truth and data journalists take the responsibility to collect and analyze them. Data bring us more questions and to inspire us to dig out the truths rather than answering our existing questions directly.
Learning resources
It is hard for this type of notes to go without a section about resources. Here is the list:
- NICAR: https://www.ire.org/nicar/
- IRE: https://www.ire.org/ . Go there to check out 3000+ tip-sheets, Educator Center, fellowships and travelling trainers.
- Open source data journalism tutorials from MaryJo Webster: http://mjwebster.github.io/DataJ/
- Centre for Investigative Journalism: https://www.tcij.org/ . Go there to check out conference and fellowships if you want to study IJ/DJ in the UK.
- Microsoft’s Excel Training Center https://support.office.com/en-us/article/Excel-video-training-9bc05390-e94c-46af-a5b3-d7c22f6990bb
- The Spreadsheet Page – John Walkenbach: http://spreadsheetpage.com/
- About.com’s Spreadsheets Page: https://www.thoughtco.com/spreadsheets-4133447( previously spreadsheets.about.com )
- Chandoo.org: https://chandoo.org/
- “How to Use Excel: The Essential Training Guide for Data-Driven Marketing”(free ebook) http://learn.supply.com/wp-content/uploads/how-to-use-excel.pdf
- “9 Excel Templates to Make Marketing Easier” (free templates) https://offers.hubspot.com/excel-templates-to-make-marketing-easier
- “How to Use Excel: 14 Simple Excel Shortcuts, Tips, Tricks” (blog post) https://blog.hubspot.com/marketing/how-to-use-excel-tips
- “40 Handy Excel Shortcuts You Can’t Live Without” (blog post) https://blog.hubspot.com/marketing/excel-shortcuts
- “10 Design Tips to Create Beautiful Excel Charts and Graphs in 2017” (blog post) https://blog.hubspot.com/marketing/excel-graph-tricks-list
- “How to Create a Pivot Table in Excel: A Step-by-Step Tutorial” (Video & blog post) https://blog.hubspot.com/marketing/how-to-create-pivot-table-tutorial-ht
Author/ Pili Hu
Notes contributor/ Bonnie Yu, Yutong Wang, Lin Gu
Researcher/ Bobo Wei
Editor/ Pili Hu

Pingback: Tech in IJ: An observation and rethink after GIJC17 – The Data & News Society