
The Rise and Rise of ICO in late 2017
If you still don’t know what is “blockchain” or what is “bitcoin”, The recent work from Max Galka will assure you this is the high time to do some self-study, or you will miss the birth time of “another Internet”. The idea of ICO, Initial Coin/Chain Offering, is an analogy of IPO. With the inception of “smart contract” capability, fundraising, a process to exchange currency to certificate, can be done in a distributed manner. The “currency” in the chain world can be Ethereum, NEO, BitCoin, … The “certificate” in the chain world is called “token” so the ICO process is also referred to as “token sale”. The convenience of ICO gains rapid growth with crazy capitals pouring into this field. Just check out this interactive/ animated token sale history.

Screenshot: The ICO Market Cap to date (Nov 2017)
How Bitcoin works in one infographic
SCMP has been well known for its large-sized infographics printed on newspaper. It never disappoints us by explaining complex things in a single image. In this work, Dennis Wong covers all the fundamentals of BitCoin with rich visual elements. It includes asymmetric encryption, consensus building, miner, hash, incentives, chain structure, … In one word, if you just get started, this is the only one infographic you need.
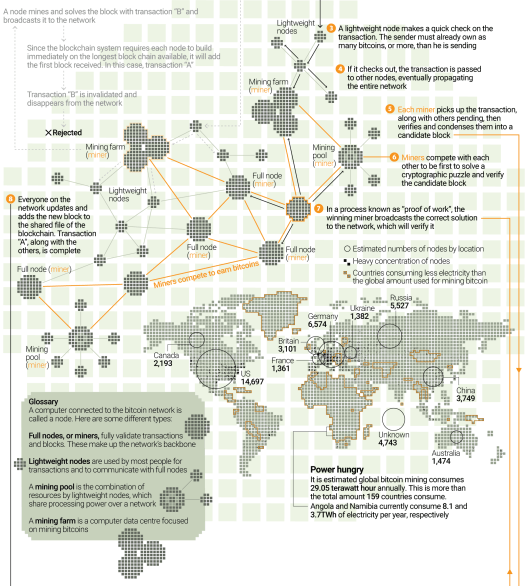
Screenshot: “What’s in your virtual wallet? An illustrated guide to bitcoin” by SCMP
A world map of Bitcoin Core nodes
The BitCoin network is guarded by “Core” nodes, i.e. those running in full mode, recording full history and validating new transactions on this network. Here is a world map of Bitcoin Core nodes. It is interesting to see that there is only a small fraction of Core nodes in China, although a large portion of mining powers come from China, e.g. AntPool alone makes up 18.8% computing power. Another visualisation of the nodes uptime can be found here. The project is also open source on GitHub.
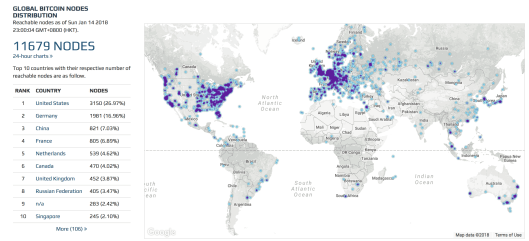
Screenshot: BitNodes
Fact sheet of BitCoin
How many blocks are there? What is the current price? What are the total computing power? Quick answers to those questions can be found on this project. It tracks the transactions in BitCoin network, provisions API for developers and provides direct charts for quick references.
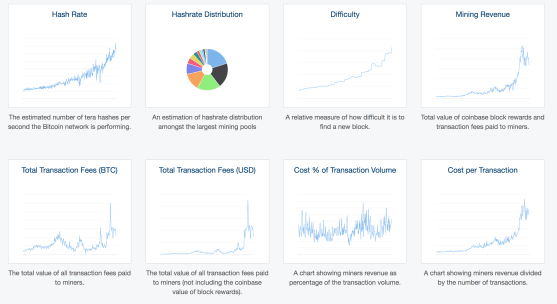
Screenshot: Key data and charts about BitCoin.
A TreeMap of Coin’s Market Caps
TreeMap is a powerful way of showing “market share” type of data.
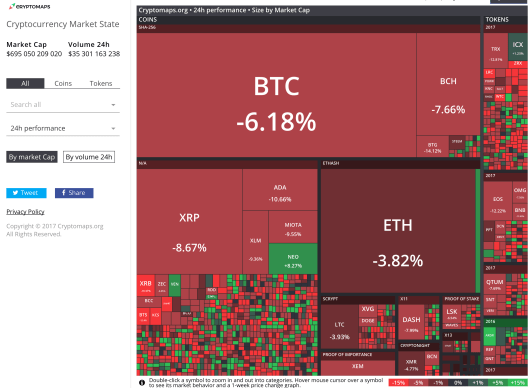
Screenshot: Cryptomaps
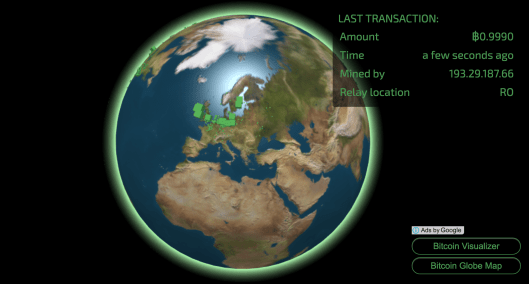
Real time BitCoin transactions on 3D globe
The project well displays geographical data and volume data. One can notice that Europe is very active as of the writing. However, it is a bit difficult to gain an overall picture from this real-time show case. Checkout the project at: https://blocks.wizb.it/
Listen to the BitCoin transactions
Data visualisation is the process to transform data to visual elements. “Data Auralization” is the process to transform data into aural elements. By tuning a real-time infinitely generated song from Bitcoin transactions, the BitListen project is highly enjoyable in the background, like a Campanula hung from the rooftop. Will some abnormal transactions catch your attention? Try it in your browser.
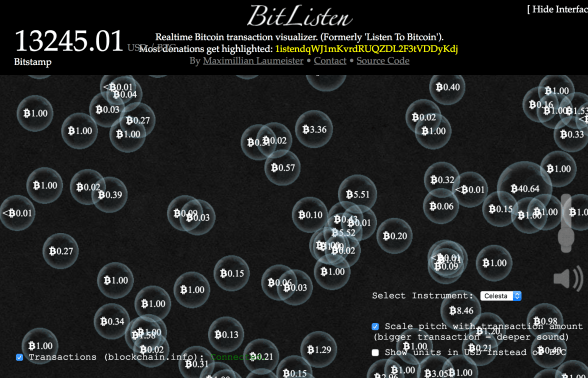
Screenshot: BitListen
Bitcoin transaction sizes over time
This video show BitCoin transactions from the genesis block in 2009. There are three axes: time, size, volume. One can see that there are more and more transactions. Also, large blocks are rare in the early years but grows fast later on.
A family tree of “altcoins”
The applicability of BitCoins have long been constrained by its initial parameters. People have created many “forked” versions of BitCoins, which essentially run similar software with different parameters. Those forked coins can be tracked from this “family tree”. The project is an awesome starting point for historians.
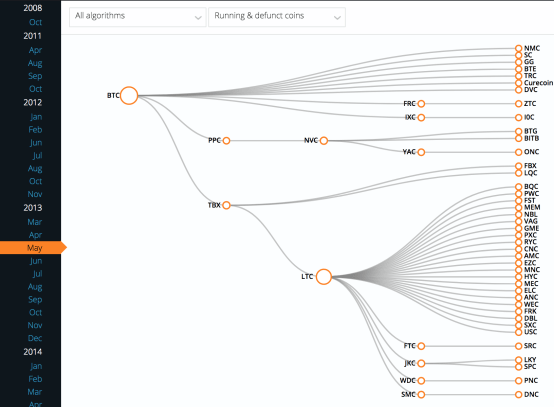
Screenshot: Map of Coins (May 2013)
The Blockchain eco-system
Blockchain is more than BitCoin, or the universe of altcoins. There are many other players in this eco-system that can is well summarised by the recent posts on TechCrunch.
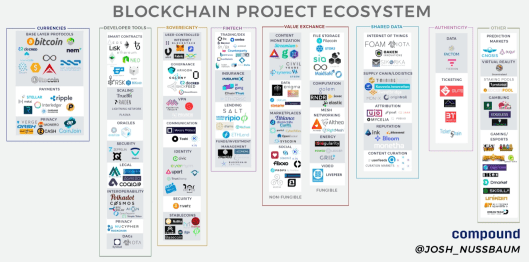
Screenshot: The Blockchain Eco-system
Author/ Pili Hu
Editor Note – This is a special issue of the Data News of the Week. Blockchain is gaining tremendous attention recently and deserves the title “News of the Year”. In this issue, we pick a few interesting data visualisations and news reports about blockchain, from novice level to expert level. Interested readers are welcome to suggest more visualisation works by leaving comments.
Data News of the Week (DNW) is a weekly issue of news summaries hand picked by our editors. It features a GLOCAL (global+local) perspective for the topic of concern. It tracks the latest developments from the industry and academics for methodology, tools, datasets and news agenda.
