
 Summary: In this article, under the context of Hong Kong’s Mandatory Provident Fund scheme (MPF), we find that some Exchange Traded Fund (ETF) occupy large holdings in a particular MPF fund. By calculating the tracking errors over the past ten years, the year of 2008 stands out with the highest tracking error, which corresponds with the global financial crisis. In other years with more stable stock markets, ETF performs relatively well. We also calculate returns between two ETFs and the indexes they track respectively; the results turn out to be different.
We use Python as a calculator, rely on pandas to read csv files downloaded from Yahoo Finance, and time series to present data in the form of charts.
Background
Hong Kong has a rapidly aging society. According to the Population Projections released by Census and Statistics Department, HK is expected to have a third of its population that aged 65 and above by the mid of 21st century. There is a growing concern over the issue of social security especially for the elderly, since the burden for the employed population in the future to take care of the retirees will be unbearable.
What is Mandatory Provident Fund (MPF)?
Since 2000, Hong Kong started to implement the system of Mandatory Provident Fund (MPF), a compulsory saving scheme for the retirement of HK citizens. Every resident who earns over HK$7,100 per month is required to participate in the MPF scheme till the age of 65. Under the scheme, the employer and the employee contribute 5 percent of employee’s salary respectively (a total of 10%). At present, the limit amount of contribution is HK$ 1,500 per month. In general, individuals could only retrieve their cumulative returns after retirement.
Although the MPF provider is selected by the employer, employees are free to choose different investment options with varied risks available from a single provider. For instance, HSBC MPF offers dozens of constituent funds under two major plans.

Risk rating for constituent funds
*In our case, we assume that the employee has never changed his job, the MPF provider and the specific fund.
According to MPF market share at Sep 30, 2017, HSBC accounts for 21.5%, as the second largest sponsor within the entire MPF market. In this analysis, we select HSBC MPF as a case study.
ETF is one of the fastest growing investment products in the world. Warren Buffett, the CEO of Berkshire Hathaway Inc, one of the most successful American business magnates has highly recommended non-professional investors to invest in ETF. Let’s find out the reason behind his investment philosophy.
What is Exchange Traded Fund (ETF)?
Exchange Traded Fund (ETF) is defined as a marketable security that tracks an index, a commodity, bonds, or a basket of assets like an index fund, and often described as a passive investment strategy. ETF investment is suitable for investors who tend to diversify risk and pursue stable returns.
Compared with traditional funds, in the Hong Kong market, ETF does not charge any subscription fees and carries an expense ratio including management fees ranging from 0.15% to 1.49%. The lower total cost of the ETF means that investors can enjoy more return on the fund.
In addition, ETF can track the trend of the index, and does not require investors to spend time and effort on individual assets. It is suitable for investors who do not have enough time and energy or lack of experience to analyze individual assets.
However, one of the disadvantages of ETF lies in certain tracking errors, which will be discussed later.
ETFs in the MPF
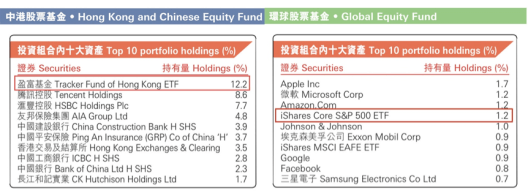
EFT in TOP 10 portfolio holdings
Hong Kong and Chinese Equity Fund and Global Equity Fund are two constituent funds from HSBC MPF, in which Tracker Fund of Hong Kong (TraHK) tops the portfolio holdings inside the former and iShares Core S&P 500 ETF ranks second place in the latter.
We try to see if an employee chooses to invest his salary into a fund that contains larger holdings of ETF, whether his option is wise or not?
Tracker Fund of Hong Kong (TraHK)
Tracker Fund of Hong Kong (TraHK) is an ETF tracks the performance of the Hang Seng Index(HSI) in the Hong Kong stock market. It represents the beneficial interest of 50 constituent stocks of HIS. In Jan 2018, TraHK was the most active ETF in HK, with average daily turnout up to $HK 1,665 million.
The graph below shows a trend that compares the daily open price of TraHK with HSI from the start of 2008 to the end of 2017. The blue line represents the ETF and the red one stands for HSI. We can see that they are intertwined.
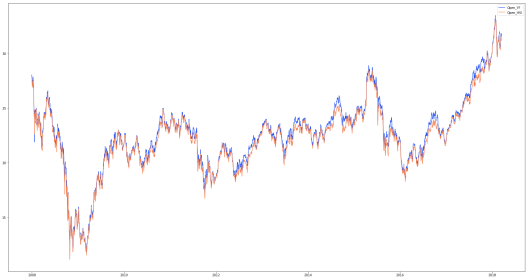
Daily open price of TraHK with HSI
iShares Core S&P 500 ETF
iShares Core S&P 500 ETF is an ETF incorporated in the USA, and tracks the performance of the S&P 500 Index. The ETF invests in all 500 stocks that comprise the index, and holds predominantly large-cap stocks from U.S. companies. It weights the holdings using a market capitalization methodology – and rebalances quarterly.
The graph below shows a trend that compares the daily open price of iShares Core S&P 500 with S&P 500 Index from the start of 2008 to the end of 2017. The blue line represents the ETF and the red one stands for S&P 500 Index. It can be seen that they are very similar as well.
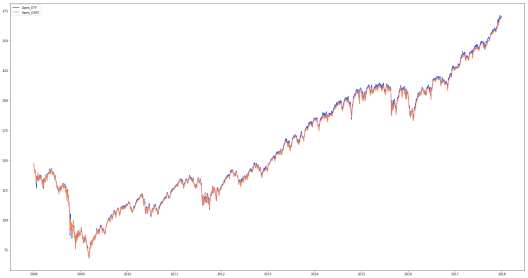
Daily open price of iShares Core S&P 500
What is a ‘Tracking Error’?
Tracking error is the divergence between the price behavior of a position or a portfolio and the price behavior of a benchmark. This is often in the context of an ETF that did not work as effectively as intended, creating an unexpected profit or loss instead.
Tracking error is reported as a standard deviation percentage difference, which reports the difference between the return an investor receives and that of the benchmark he was attempting to imitate.
Breaking down ‘Tracking Error’
Since portfolio risk is often measured against a benchmark, tracking error is a commonly used metric to gauge how well an investment is performing. Tracking error shows an investment’s consistency versus a benchmark over a given period of time. Even portfolios that are perfectly indexed against a benchmark behave differently than the benchmark, even though this difference on a day-to-day, quarter-to-quarter or year-to-year basis may be ever so slight. Tracking error is used to quantify this difference.
Calculation of ‘Tracking Error’
Tracking error is the standard deviation of the difference between the returns of an investment and its benchmark.
Given a sequence of returns for an investment or portfolio and its benchmark, tracking error is calculated as follows:
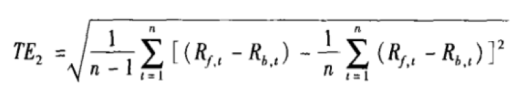
t = 1,2,3, ……, n (n equals the number of samples)
R equals the fund’s return for t period
R equals the benchmark’s return for t period
We calculated the tracking error between TraHK and Hang Seng Index as well as the tracking error between iShares Core S&P 500(ETF) and S&P 500 Index from 2008 to 2017.
|
Tracker Fund of Hong Kong |
iShares Core S&P 500 (ETF) | |
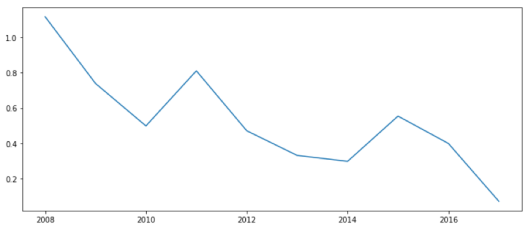
| Year | Tracking error (%) | Tracking error (%) |
| 2008 | 1.120413 | 1.116971 |
| 2009 | 0.726350 | 0.739324 |
| 2010 | 0.470770 | 0.499136 |
| 2011 | 0.364351 | 0.810954 |
| 2012 | 0.353487 | 0.471678 |
| 2013 | 0.361779 | 0.332267 |
| 2014 | 0.305306 | 0.298797 |
| 2015 | 0.421090 | 0.554735 |
| 2016 | 0.340925 | 0.399875 |
| 2017 | 0.228415 | 0.072787 |

Tracker Fund of Hong Kong
From the chart, we can see that the tracking error moved from big to small between 2008 and 2017. Hang Seng Index fell sharply for the global financial crisis in 2008. The stock market crash made the TraHK do not work as effectively as intended and the tracking error for 2008 was big. The financial sector stabilized and stock rebounded when the economy recovered in the past 10 years. The tracking error became small with the stock market rally.
iShares Core S&P 500 ETF
To compare the charts, we can know different ETFs have different performance while they show the similar trend in the last decade.
The 2008 financial crisis is considered by many economists to have been the worst financial crisis since the Great Depression of the 1930s. The year 2008 is a special year. We take the year 2008 as an example to analyze the tracking error between TraHk and HSI in the extreme situation.
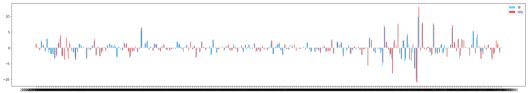
TraHK’s and Hang Seng’s return for 2008
The bar in blue means the TraHK’s return for 2008 and the bar in red means the Hang Seng Index’s return for 2008.
On September 16, 2008, failures of massive financial institutions in the United States, due primarily to exposure to packaged subprime loans and credit default swaps issued to ensure these loans and their issuers, rapidly devolved into a global crisis. This resulted in sharp reductions in the value of stocks and commodities worldwide. Hong Kong stock market followed US and fell sharply.
From the chart, we can see that the HSI’s return fluctuated in the fourth quarter of 2008. Meanwhile, TraHk’s return changed with it. But the difference between their return also became bigger.
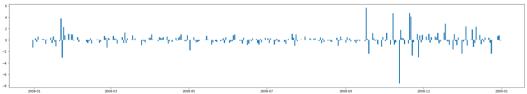
Trend of tracking error
To see the difference clearly, we calculated the tracking error between the two. As expected, the tracking error became very big in the fourth quarter of 2008.
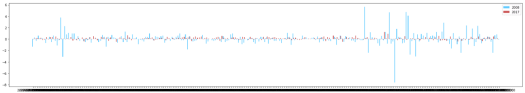
Tracking error of 2008 and 2017
The bar in blue means the tracking error for 2008 and the bar in red means the tracking error for 2017.
It is clear that the tracking error for 2008 was big while the tracking error for 2017 was small. From this, we can know an ETF works effectively in the good year while it does not track the benchmark well in the bad year.
Calculation of returns
Except for tracking errors, management fees also make a difference between the returns of ETF and stocks. These fees are deducted from the funds’ portfolios to compensate the fund manager for overseeing the holdings and administration. In our case, TraHK’s management fees are 1.45% per year and iShares Core S&P 500 ETF’s are 0.75%.
To compare with the returns of ETF and stocks, we suppose that the performance of the index which the specific ETF is tracking can represent the performance of stocks in the local market. So we use the ups and downs of the values of ETF and the index to calculate returns. The simulated result is shown in the following figure.
Returns of ETF and stocks
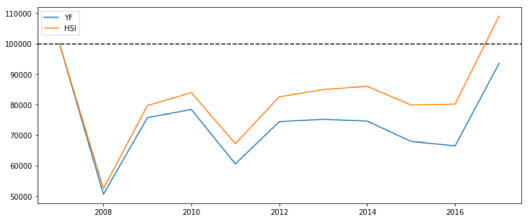
Supposing that we invest 100,000 dollars as our initial capital in the ETF and the index at the same time in early 2008, when a huge financial crisis was about to occur, and compare the amount of money we have each year with the initial capital.
The blue line represents TraHK and the yellow line represents Hang Seng Index, and the difference between their returns is quite large due to the tracking error and management fees.

Return of TraHK and Hang Seng Index
In this picture, the blue line represents iShares Core S&P 500 ETF and the yellow line represents S&P 500 Index, and the difference between their returns is small, which means the returns of this ETF is well-tracked the whole market’s performance.
Codes and data
Interested readers can download codes and data here: Group 6 – Tracking Errors
References
- Mandatory Provident Fund Schemes Authority. Retrieved from: http://www.mpfa.org.hk/tch/main/index.jsp
- Hong Kong Population Projections 2017-2066. Retrieved from: https://www.statistics.gov.hk/pub/B1120015072017XXXXB0100.pdf
- MPF market share as at September 2017. Retrieved from: https://www.willistowerswatson.com/en-HK/insights/2018/01/mpfexpress-market-share-2017-q3
- What is ETF that everybody has been discussing all about? Retrieved from: https://mp.weixin.qq.com/s/1cwf9_bUeTSePc6k7_XM4w
- HSBC MPF Fund Fact Sheet. Retrieved from: https://www.personal.hsbc.com.hk/1/PA_esf-ca-app-content/content/mpf/common/pdf/invrptce1.pdf
- Exchange traded funds and Leverage and Reverse Product Market Overview. Retrieved from: http://www.hkex.com.hk/-/media/HKEX-Market/Products/Securities/ETP/ETF-and-L-and-I-Product-Market-Perspective/2018/ETFLIProductMarketPerspective_201801_tc.pdf
- Profile of iShares Core S&P 500 ETF. Retrieved from: https://www.bloomberg.com/quote/IVV:US
- Tracking Error. Retrieved from: https://www.investopedia.com/terms/t/trackingerror.asp
- Empirical analysis of the tracking error of index fund. Retrieved from: https://wenku.baidu.com/view/cb83ae7a5022aaea998f0fdc.html
- Financial crisis of 2007-2008. Retrieved from: https://en.wikipedia.org/wiki/Financial_crisis_of_2007%E2%80%932008
- Stock market crash. Retrieved from: https://en.wikipedia.org/wiki/Stock_market_crash
Notes from Lecturer
The topic selected is highly concerned because index tracking funds/ stocks are making up a larger and larger portion of the financial market. The analysis and articulation of this article can be improved mainly due to background.
Both excess return and tracking error are interesting object of study. Vanguard made a very concise tutorial on this subjects. Sometimes, investors are not very concerned of “tracking error”, a measure of consistency, as long as the return is good. The article can also discuss more on why constant excessing tracking funds are not always preferred. That is, if some tracking fund performs higher and higher compared with the benchmark, why is that a disadvantage in some cases (thus, people try to quantify and seek for less tracking error)?
In terms of visualisation, the superimposed lines in chart are not easy to read. Readers may be more interested in the difference so one can try to visualise the difference or the percentage ETF-to-benchmark.
As to the return analysis, besides considering the operation fee, one can also factor in the effect of tracking error. The annualised tracking error and excess return may have higher impact if one uses an Automatic Investment Plan (AIP).
The writing in general can be improved, but the abstract is good in that it hits the punchline directly, i.e. 2008 saw a large tracking error while other years are smaller.
— Pili Hu (Mar 26, 2018)
Author/ Xiao Chao, Zhang Jin, Zhu Jieyan
Editor/ Yucan Xu
