• Home
  • Event
  • Article
    • Gallery
    • Opinion
    • Resources
  • About
    • Founding Members
    • Steering Committee
    • Executive Officers
  • Newsletter

The Data & News Society

~ news/numbers; stats/stories

The Data & News Society

Monthly Archives: February 2018

Tableau Student Viz Assignment Contest (Jan 8 – May 29, 2018)

03 Saturday Feb 2018

Posted by Roy Tang in Announcements

≈ Leave a comment

Tags

#Contest, Data Visualization, Tableau

Just created a visual for an assignment? Turn it into an awarding winning work by submitting it to the Tableau Student Vis Assignment Contest (Round II 2018)!

perusingnytimes

(Round I First PlaceWinner, Perusing the New York Times #1 Best Seller List)

Entry Eligibility:

  • Visuals should be created in Tableau, within the period of Jan 8 – May 29, 2018.
  • Participants should be currently enrolled in a degree-granting program.
  • Dataset used should publicly accessible.
  • Submit your work by publishing your visual to your Tableau Public profile

Continue reading →

Create Simple Filled Map (HK) in Tableau

02 Friday Feb 2018

Posted by Roy Tang in Tool, Tutorial

≈ 3 Comments

Tags

Excel, HK Fill Map, Tableau

Creating a filled map using JavaScript libraries might take you much time to get it work. This tutorial demonstrates how data visualization tool Tableau provide a decent and handy solution (*Note: Hong Kong Map feature is only available after version 10).

The final product can be found here: https://public.tableau.com/profile/roy.tang#!/vizhome/SimpleFilledMap/Dashboard1

Continue reading →

Data News of the Week | Trump Lies and His Job Promises

01 Thursday Feb 2018

Posted by Erin Chan in Article, Resources

≈ 3 Comments

Tags

data, Data Visualization, DNW, Trump

It has been more than a year under Donald Trump’s administration. Trump has made a lot of groundless claims and job promises which happen arbitrarily. Some newsagents keep a record of it and visualize the frequency. To criticise the act of the president in a more grounded way, The New York Times compares the lies frequency between Trump’s and the former president Barack Obama. We also dug deeper into one of his promises in his election platform which is job creation and employment enhancement. From which, we adopted a project from ProPublica. The following will discuss the visualization, the use of words and the effects of the two projects. 

Continue reading →

Calculate Marketing Objective for Your Media Startup

01 Thursday Feb 2018

Posted by chico_x in Tutorial

≈ Leave a comment

Tags

Business Model, calculator, COMM7780/JOUR7280, Media, Python

题图.jpg

Summary: We use Python to make a financial calculator to help media startup founders to find out the break-even point of their business model. In other words, it can estimate how many visitors should they acquire to become profitable. We will also show you how to numerically solve the equation and study the sensitivity of key operating parameters, like member fee and CPM of Ads.

Start up A New Business

First of all, you should start up your new business. As all of our group members will graduate from the communication school of HKBU, we want to start up a new business together in the media industry. After doing analysis about the industry and competitors, we decided to found up a news website about new technologies, innovations and application in the media industry.

Business Model

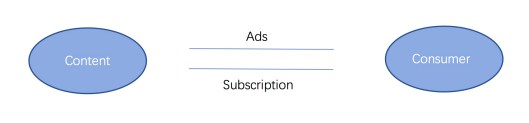
Basically, our business model is like this. We produce high-quality content in different formats to help our target audience to know what is the newest trend and hot topic in the media industry. and on the monetization side, we have two ways to get revenues. The first is by combining ads into our website like feed ads, and the other way is by charging the subscription fee for exclusive content.

1517387451984.jpg

Before we start to find investors, however, we should first get to know how much money is needed to make the website work.

Continue reading →

Newer posts →

Top Posts & Pages

  • Overuse of Plastic Disposable Tableware in Hong Kong
  • Google Sheets 技巧總結
  • Create Simple Filled Map (HK) in Tableau
  • About
  • The effectiveness of Hong Kong public libraries is diminishing

Recent Posts

  • A dossier of data journalism teaching strategies: Words from journalism educators worldwide
  • “中国数据可视化大赛”创作者专访:数据“几人行”
  • “Whoah, wait a minute, every reporter needs to be a data reporter”: Conversations with two generations of data journalists at the Los Angeles Times
  • Aaron Mendelson: Would numbers work with radio?
  • 首届“中国数据可视化大赛”启动-数据中的宏观和微观世界
  • Job Opportunity: Market Information Specialist at Unum Networks

Recent Comments

A quick video I made… on New towns fail to be self-cont…
Erin Chan on Create Simple Filled Map (HK)…
National Congress: s… on “Big Data” Tells Y…
Pili Hu on Data News of the Week | Gender…
Pili Hu on Key Takes from Jessica Lo…

Archives

  • August 2019
  • June 2019
  • April 2019
  • March 2019
  • February 2019
  • December 2018
  • November 2018
  • October 2018
  • September 2018
  • June 2018
  • May 2018
  • April 2018
  • March 2018
  • February 2018
  • January 2018
  • December 2017
  • November 2017
  • October 2017
  • September 2017
  • August 2017
  • May 2017
  • April 2017
  • March 2017
  • February 2017
  • January 2017
  • December 2016
  • November 2016
  • October 2016
  • September 2016
  • August 2016
  • July 2016
  • June 2016
  • May 2016
  • April 2016
  • March 2016
  • February 2016
  • January 2016
  • December 2015
  • November 2015

Meta

  • Register
  • Log in
  • Entries feed
  • Comments feed
  • WordPress.com

Recent Posts

  • A dossier of data journalism teaching strategies: Words from journalism educators worldwide
  • “中国数据可视化大赛”创作者专访:数据“几人行”
  • “Whoah, wait a minute, every reporter needs to be a data reporter”: Conversations with two generations of data journalists at the Los Angeles Times
  • Aaron Mendelson: Would numbers work with radio?
  • 首届“中国数据可视化大赛”启动-数据中的宏观和微观世界

Recent Comments

A quick video I made… on New towns fail to be self-cont…
Erin Chan on Create Simple Filled Map (HK)…
National Congress: s… on “Big Data” Tells Y…
Pili Hu on Data News of the Week | Gender…
Pili Hu on Key Takes from Jessica Lo…

Archives

  • August 2019
  • June 2019
  • April 2019
  • March 2019
  • February 2019
  • December 2018
  • November 2018
  • October 2018
  • September 2018
  • June 2018
  • May 2018
  • April 2018
  • March 2018
  • February 2018
  • January 2018
  • December 2017
  • November 2017
  • October 2017
  • September 2017
  • August 2017
  • May 2017
  • April 2017
  • March 2017
  • February 2017
  • January 2017
  • December 2016
  • November 2016
  • October 2016
  • September 2016
  • August 2016
  • July 2016
  • June 2016
  • May 2016
  • April 2016
  • March 2016
  • February 2016
  • January 2016
  • December 2015
  • November 2015

Categories

  • Announcement
  • Announcements
  • Article
  • Book
  • Colloquium
  • comment
  • Event
  • Field Trip
  • Gallery
  • general
  • news story
  • Open Lecture
  • Opinion
  • Resources
  • Tool
  • Tutorial
  • Uncategorized

Meta

  • Register
  • Log in
  • Entries feed
  • Comments feed
  • WordPress.com

Blog at WordPress.com.

Cancel