• Home
  • Event
  • Article
    • Gallery
    • Opinion
    • Resources
  • About
    • Founding Members
    • Steering Committee
    • Executive Officers
  • Newsletter

The Data & News Society

~ news/numbers; stats/stories

The Data & News Society

Category Archives: Tutorial

Using Big Data to Figure Out How Fair China Daily News is

02 Friday Mar 2018

Posted by chico_x in Tutorial

≈ Leave a comment

Tags

COMM7780/JOUR7280, Objectivity of News, Python

Summary: Unfair and imbalanced news stories always mislead readers, hiding and even distort truths, thus decreasing the credibility of media as well as increasing ‘news victims’. As a qualified news organization, one must get its news as close to the fact as possible. This time we want to take China Daily as an example, to analyze whether its news is fair or not.

We decided to rely on data to quantize the requirement, thus we use python to show the most effective way to figure out the fairness of news.

Background: Difficulty to Reach Absolute Objectivity

According to the Cambridge online dictionary, objectivity means “not influenced by personal opinion or feeling.” For a long time in journalism, objectivity meant writing a story without putting any personal opinion into it.

Over the last several years, many journalists stopped using “objectivity” in favor of the word “fairness.” Complete objectivity, they reasoned, is impossible. Fairness is more possible. Fairness means that you tell a story in ways that are fair to all sides once all the available information is considered.

Telling a story fairly is more difficult than it sounds. Reporters try to put colorful images and descriptions into their stories. For fresh reporters, especially those working in a second language, it can sometimes be difficult to distinguish between colorful description and editorializing. Some words have a feeling or connotation to them that is hard to recognize. Some English words have “loaded” or “double” meanings that are extremely positive or negative. Writers should be aware of the positive or negative meanings of a word and how its use to affect an article. Also, as human beings, we all have feelings and opinions about events and issues around us—-it is sometimes difficult to conceal those feelings, especially if we feel strongly about something. These feelings sometimes come through in our stories in the words we choose.

Therefore, the TextBlob, a module of python, is designed for pointing out humans’ subjectivity in news.

Continue reading →

Data News of the Week | Gender Pay Gap: Why and How?

01 Thursday Mar 2018

Posted by harprrrr in Resources, Tutorial

≈ 1 Comment

Tags

data, data news, DNW, gender, gender gap, news game, pay gap

Professor Jordan Peterson has been the center of attention in last few weeks for participating in a number of debates regarding gender wage gap. Unlike the feminists calling for the reduction of discrimination over salary, he believes gender wage gap is an explainable consequence of multiple social factors rather than a problem caused by discrimination. Is he right? After all, why is there gender wage gap? Looking into 3 reports (Why is There a Gender Wage Gap – Our World in Data, Six Key Facts About the Gender Pay Gap – Our World in Data, Gender Pay Gap: the Day Women Start Working For Free – Washington Post) and a  published recently with analytics over statistics regarding gender wage gap will give us a thorough understanding of current gender wage gap. Continue reading →

Data News of the Week | What can we, the 20-year-old, do to change the world?

23 Friday Feb 2018

Posted by jessiepyt in Resources, Tutorial

≈ 1 Comment

Tags

data, data analysis, data cases, data collection, Data Journalism, Datamining, DNW, Heatmap, Strava

Nathan Ruser, a 20-year-old Australian National University student who is majoring in international security with a keen interest in cartography, discovered a fitness app had revealed the locations of secret military sites in Syria and elsewhere. He posted on Twitter about this, did not expect much response.

But the news ricocheted across the internet. Security experts said the Strave app’s “heat map” could be used by hostile entities glean valuable intelligence. The Pentagon said it was reviewing the situation.

How he found the news?

 “Whoever thought that operational security could be wrecked by a Fitbit?” Mr. Ruser, said in an interview with New York Times from Thailand, where he is spending part of the Australian summer break.

When he looked over Syria on Strava’s map — which is based on location data from millions of users, including military personnel, who share their exercise activity — the area “lit up with those U.S. bases,” he said.

Before publicly sharing his findings over the weekend, he discussed them in a private chat group on Twitter, made up of people interested in intelligence and security issues. “I know about two-thirds of what I know about the world from the group chats,” he said.

Continue reading →

Lightning News from Public Data Sets

22 Thursday Feb 2018

Posted by Pili Hu in Opinion, Tutorial

≈ 1 Comment

Tags

data mining, Lightning News, open data

It is time to break-down the broad concept of “data journalism”. When talking about the combination of data and news, we usually refer to two processes, sometimes conducted in an integral manner. One process is to discover news points from datasets. The datasets can provide a lead for further investigation. The final product does not necessarily reflect the usage of data. It may look the same as normal news products mainly composed of interviews and photos. This is called “data mining” in the science domain. Another process is to present news points using data. There come to all kinds of charts and interactive/ immersive presentations. This is called “data visualisation” in the science domain.

Let’s focus on the “data mining” part in this article. That is to discover news from datasets, or more precisely discover a news lead from datasets. The further development of the entire news story may take much more efforts with a combination of traditional and modern methods. For easier discussion, we treat “news” in the general form: something the audience does not know before reading, a.k.a, something that “appears new”. It could be the status update of a current affair, or it could be the “new knowledge” to the readers (probably be “common knowledge” to experts which we don’t want to waste time debating).

As advocated by the “Road to Jan”: the most profound theory takes the simplest form. As a first step, we try not using programming, or even sophisticated spreadsheet skills. One can readily find some “news” with a bit “nose for news” and be computer literate is good enough. In this article, we will demo a few news points mined by our undergraduate students from Hong Kong government data portal: https://data.gov.hk . It took around 20 minutes in the second class of a data journalism course. We start with a public dataset from the portal, check out the data tables and eyeball if there is anything interesting. The process is so quick that we would like to give it a brand name: Lightning News. One can sharpen his/her news sense and data sense by doing this as daily exercise.

Continue reading →

農曆新年學習資料大禮包!Data Journalism Learning Tools

14 Wednesday Feb 2018

Posted by Bobo Wei in Book, Resources, Tool, Tutorial

≈ Leave a comment

Tags

data, Data Journalism, data science, Data Vis

農曆新年伊始,小編在此給各位愛學習的小夥伴推薦一些學習Data Journalism有用的線上課程,資料和工具。希望新的一年,大家學業進步!順順利利!(原文部分轉載自 initiumlab.com, 有部分編輯, 點擊查看更多: 學習資料清單)

  • 系列課程:從查找資料開始、學習解讀資料的意義、資料視覺化到用資料說故事。

1.Doing Journalism with Data: First Steps, Skills and Tools(課程在LEARNO.NET平台開放,一共5節,直接註冊,免費學習)

http://learno.net/courses/doing-journalism-with-data-first-steps-skills-and-tools

2.Data Exploration and Storytelling(數據大師Alberto Cairo & Heather Krause開設)

https://publicmediaalliance.org/free-online-course-data-exploration-storytelling/

Continue reading →

Evaluate Bonds for Your Investment Plan

08 Thursday Feb 2018

Posted by chico_x in Tutorial

≈ Leave a comment

Tags

Bond, COMM7780/JOUR7280, Finance, Financial Journalism, Investment Plan, Python

Summary: Everyone seeks fortune. But managing financial affairs is not an easy cook for the general public since that business jargon and the complicated fluctuations in price have confused many investors who merely have the faintest idea of investment. At this point, bonds — a fixed income investment with a defined holding period — draws the attention of many, yet a less risky basket of this kind could still be affected by the ever-changing market.

Thus, we used Python and the universally-acknowledged bond valuation method, Discounted Cash Flow (DCF), to design an efficient and easy-understanding calculator to help green hands to estimate if they can receive the expected proportion of benefit from a given bond.

Understanding Bonds: What is a Bond and How Bonds Work

“A bond is a fixed income investment in which an investor loans money to an entity which borrows the funds for a defined period of time at a fixed interest rate.”

— Investopedia.com

图片 1.png
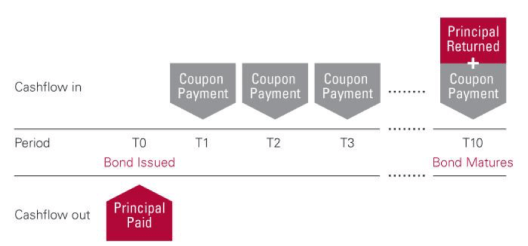
▲ A Bond’s Lifetime (Source: Vanguard)

Continue reading →

Create Simple Filled Map (HK) in Tableau

02 Friday Feb 2018

Posted by Roy Tang in Tool, Tutorial

≈ 3 Comments

Tags

Excel, HK Fill Map, Tableau

Creating a filled map using JavaScript libraries might take you much time to get it work. This tutorial demonstrates how data visualization tool Tableau provide a decent and handy solution (*Note: Hong Kong Map feature is only available after version 10).

The final product can be found here: https://public.tableau.com/profile/roy.tang#!/vizhome/SimpleFilledMap/Dashboard1

Continue reading →

Calculate Marketing Objective for Your Media Startup

01 Thursday Feb 2018

Posted by chico_x in Tutorial

≈ Leave a comment

Tags

Business Model, calculator, COMM7780/JOUR7280, Media, Python

题图.jpg

Summary: We use Python to make a financial calculator to help media startup founders to find out the break-even point of their business model. In other words, it can estimate how many visitors should they acquire to become profitable. We will also show you how to numerically solve the equation and study the sensitivity of key operating parameters, like member fee and CPM of Ads.

Start up A New Business

First of all, you should start up your new business. As all of our group members will graduate from the communication school of HKBU, we want to start up a new business together in the media industry. After doing analysis about the industry and competitors, we decided to found up a news website about new technologies, innovations and application in the media industry.

Business Model

Basically, our business model is like this. We produce high-quality content in different formats to help our target audience to know what is the newest trend and hot topic in the media industry. and on the monetization side, we have two ways to get revenues. The first is by combining ads into our website like feed ads, and the other way is by charging the subscription fee for exclusive content.

1517387451984.jpg

Before we start to find investors, however, we should first get to know how much money is needed to make the website work.

Continue reading →

Use Kumu To Make A Relationship Graph For Les Misérables

17 Wednesday Jan 2018

Posted by HE Jiaxin (Ellen) in Tool, Tutorial

≈ Leave a comment

Tags

Kumu, Network Analysis, Relationship Graph

This tutorial demonstrates how to use Kumu to make an interactive relationship graph for character co-occurence network in Les Misérables.

[iframe src=”https://embed.kumu.io/29becd08f89339d0204672d126a70167″%5D

Continue reading →

My First Application of FOI in Hong Kong

13 Saturday Jan 2018

Posted by graceli618 in Resources, Tutorial

≈ 1 Comment

Tags

data collection, GIJC17, open data, open government

It was new for me when I heard anyone can acquire almost any data from HK government for legitimate reasons under that Code on Access to Information.

This code is a response to the notion of “FOI” (For Our Information; Freedom Of Information), which calls for citizens’ free access to government information so that the transparency of government management can be ensured and citizen rights can be protected.

According to Wiki, In 2006, nearly 70 countries went through relative legislation. Among these laws are USA’s FOIA (Freedom of Information Act) and, of course, Hong Kong’s Code on Access to information.

Despite the code in place, a practical question remains. Will those government officers fulfill their duty and do give reply to every single data request? So I decided to give a try on Accessinfo.hk.

Accessinfo.hk is a website positioned as a platform for citizens to post their information requests to authorities and receive feedback. It was initiated by a group of Open Data activist, including Guy Freeman, who is currently data scientist in HK01. The website publishes every question and answer to everyone, and, at the same time, monitors the process. Before localizing the Alaveteli system ( http://alaveteli.org/ ) to Hong Kong, its sister site WhatDoTheyKnow ( https://www.whatdotheyknow.com/ ) had already seen wide application in the United Kingdom.

accessinfo

Screenshot: accessinfo.hk

Continue reading →

← Older posts
Newer posts →

Top Posts & Pages

  • The Setup of D&N Society
  • Create Simple Filled Map (HK) in Tableau
  • 当一个data scientist是种什么体验
  • New towns fail to be self-contained as planned, government data shows
  • Learn Spreadsheet to Mine Data and Jumpstart Your Data Journalism Career - A Sharing by Aimee Edmondson

Recent Posts

  • A dossier of data journalism teaching strategies: Words from journalism educators worldwide
  • “中国数据可视化大赛”创作者专访:数据“几人行”
  • “Whoah, wait a minute, every reporter needs to be a data reporter”: Conversations with two generations of data journalists at the Los Angeles Times
  • Aaron Mendelson: Would numbers work with radio?
  • 首届“中国数据可视化大赛”启动-数据中的宏观和微观世界
  • Job Opportunity: Market Information Specialist at Unum Networks

Recent Comments

Unknown's avatarA quick video I made… on New towns fail to be self-cont…
Erin Chan's avatarErin Chan on Create Simple Filled Map (HK)…
National Congress: s… on “Big Data” Tells Y…
Pili Hu's avatarPili Hu on Data News of the Week | Gender…
Pili Hu's avatarPili Hu on Key Takes from Jessica Lo…

Archives

  • August 2019
  • June 2019
  • April 2019
  • March 2019
  • February 2019
  • December 2018
  • November 2018
  • October 2018
  • September 2018
  • June 2018
  • May 2018
  • April 2018
  • March 2018
  • February 2018
  • January 2018
  • December 2017
  • November 2017
  • October 2017
  • September 2017
  • August 2017
  • May 2017
  • April 2017
  • March 2017
  • February 2017
  • January 2017
  • December 2016
  • November 2016
  • October 2016
  • September 2016
  • August 2016
  • July 2016
  • June 2016
  • May 2016
  • April 2016
  • March 2016
  • February 2016
  • January 2016
  • December 2015
  • November 2015

Meta

  • Create account
  • Log in
  • Entries feed
  • Comments feed
  • WordPress.com

Recent Posts

  • A dossier of data journalism teaching strategies: Words from journalism educators worldwide
  • “中国数据可视化大赛”创作者专访:数据“几人行”
  • “Whoah, wait a minute, every reporter needs to be a data reporter”: Conversations with two generations of data journalists at the Los Angeles Times
  • Aaron Mendelson: Would numbers work with radio?
  • 首届“中国数据可视化大赛”启动-数据中的宏观和微观世界

Recent Comments

Unknown's avatarA quick video I made… on New towns fail to be self-cont…
Erin Chan's avatarErin Chan on Create Simple Filled Map (HK)…
National Congress: s… on “Big Data” Tells Y…
Pili Hu's avatarPili Hu on Data News of the Week | Gender…
Pili Hu's avatarPili Hu on Key Takes from Jessica Lo…

Archives

  • August 2019
  • June 2019
  • April 2019
  • March 2019
  • February 2019
  • December 2018
  • November 2018
  • October 2018
  • September 2018
  • June 2018
  • May 2018
  • April 2018
  • March 2018
  • February 2018
  • January 2018
  • December 2017
  • November 2017
  • October 2017
  • September 2017
  • August 2017
  • May 2017
  • April 2017
  • March 2017
  • February 2017
  • January 2017
  • December 2016
  • November 2016
  • October 2016
  • September 2016
  • August 2016
  • July 2016
  • June 2016
  • May 2016
  • April 2016
  • March 2016
  • February 2016
  • January 2016
  • December 2015
  • November 2015

Categories

  • Announcement
  • Announcements
  • Article
  • Book
  • Colloquium
  • comment
  • Event
  • Field Trip
  • Gallery
  • general
  • news story
  • Open Lecture
  • Opinion
  • Resources
  • Tool
  • Tutorial
  • Uncategorized

Meta

  • Create account
  • Log in
  • Entries feed
  • Comments feed
  • WordPress.com

Blog at WordPress.com.

  • Subscribe Subscribed
    • The Data & News Society
    • Already have a WordPress.com account? Log in now.
    • The Data & News Society
    • Subscribe Subscribed
    • Sign up
    • Log in
    • Report this content
    • View site in Reader
    • Manage subscriptions
    • Collapse this bar
 

Loading Comments...